This site uses cookies to improve your experience. To help us insure we adhere to various privacy regulations, please select your country/region of residence. If you do not select a country, we will assume you are from the United States. Select your Cookie Settings or view our Privacy Policy and Terms of Use.
Cookie Settings
Cookies and similar technologies are used on this website for proper function of the website, for tracking performance analytics and for marketing purposes. We and some of our third-party providers may use cookie data for various purposes. Please review the cookie settings below and choose your preference.
Used for the proper function of the website
Used for monitoring website traffic and interactions
Cookie Settings
Cookies and similar technologies are used on this website for proper function of the website, for tracking performance analytics and for marketing purposes. We and some of our third-party providers may use cookie data for various purposes. Please review the cookie settings below and choose your preference.
Strictly Necessary: Used for the proper function of the website
Performance/Analytics: Used for monitoring website traffic and interactions
Events Data + AI Summit Data + AI World Tour Data Intelligence Days Event Calendar Blog and Podcasts Databricks Blog Explore news, product announcements, and more Databricks Mosaic Research Blog Discover the latest in our Gen AI research Data Brew Podcast Let’s talk data!
Every data scientist has been there: downsampling a dataset because it won’t fit into memory or hacking together a way to let a business user interact with a machine learning model. Machine Learning in your Spreadsheets BQML training and prediction from a Google Sheet Many data conversations start and end in a spreadsheet.
For developers and data practitioners, this shift presents both opportunity and challenge. Traditional machine learning systems excel at classification, prediction, and optimization—they analyze existing data to make decisions about new inputs. This difference shapes everything about how you work with these systems.
By Shamima Sultana on June 19, 2025 in Data Science Image by Editor | Midjourney While Python-based tools like Streamlit are popular for creating data dashboards, Excel remains one of the most accessible and powerful platforms for building interactive data visualizations. Datalabels on top of columns.
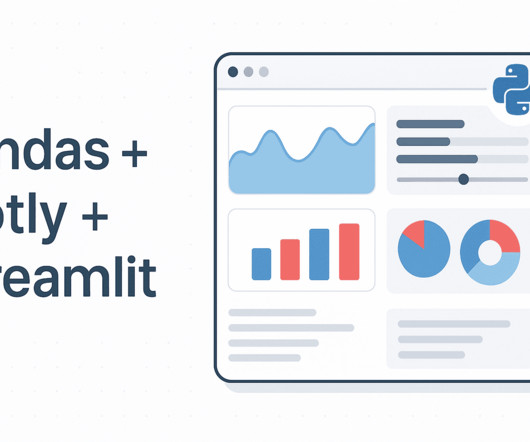
By Vinod Chugani on June 27, 2025 in Data Science Image by Author | ChatGPT Introduction Creating interactive web-based data dashboards in Python is easier than ever when you combine the strengths of Streamlit , Pandas , and Plotly. unique()) # Filter data filtered_df = df[(df[Region].isin(regions)) unique(), default=df[Region].unique())
Events Data + AI Summit Data + AI World Tour Data Intelligence Days Event Calendar Blog and Podcasts Databricks Blog Explore news, product announcements, and more Databricks Mosaic Research Blog Discover the latest in our Gen AI research Data Brew Podcast Let’s talk data!
By Cornellius Yudha Wijaya , KDnuggets Technical Content Specialist on June 18, 2025 in Data Science Image by Author As a data scientist, Jupyter Notebook has become one of the first platforms we learn to use, as it allows for easier data manipulation compared to standard programming IDEs.
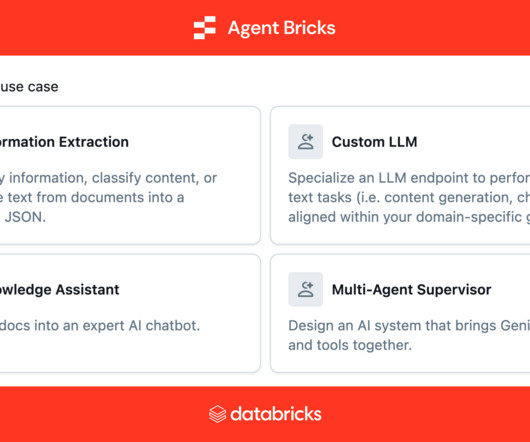
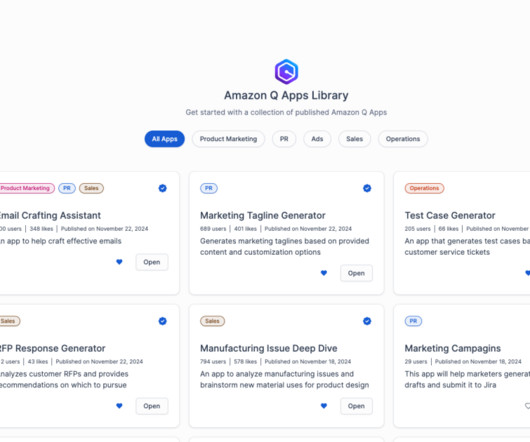
We are excited to announce new features that allow creation of more powerful apps, while giving more governance control using Amazon Q Apps, a capability within Amazon Q Business that allows you to create generative AI-powered apps based on your organizations data. The next feature we discuss is custom labels.
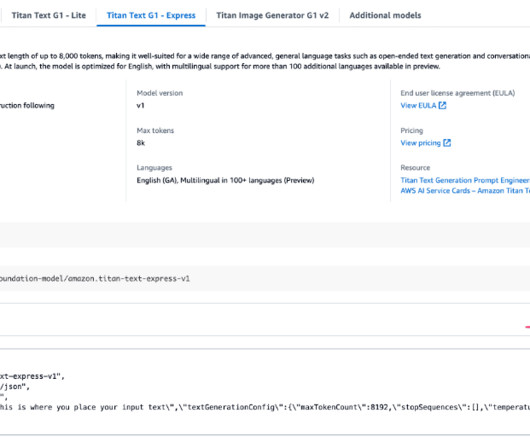
In this blog post, we demonstrate prompt engineering techniques to generate accurate and relevant analysis of tabular data using industry-specific language. This is done by providing large language models (LLMs) in-context sample data with features and labels in the prompt.
In the context of generative AI , significant progress has been made in developing multimodal embedding models that can embed various data modalities—such as text, image, video, and audio data—into a shared vector space. Alternatively, you could directly upload the dataset to an S3 bucket by using the AWS Management Console.
Publish AI, ML & data-science insights to a global community of data professionals. In this blog, we’ll take a fun, hands-on approach to learning the key Gradio components by building a text-to-speech (TTS) web application that you can run on an AI PC or Intel® Tiber™ AI Cloud and share with others.
This setup enables the model to learn from human-labeleddata, refining its ability to produce content that aligns with natural human expectations. We guide you through deploying the necessary infrastructure using AWS CloudFormation , creating an internal labeling workforce, and setting up your first labeling job.
Events Data + AI Summit Data + AI World Tour Data Intelligence Days Event Calendar Blog and Podcasts Databricks Blog Explore news, product announcements, and more Databricks Mosaic Research Blog Discover the latest in our Gen AI research Data Brew Podcast Let’s talk data!
By Jayita Gulati on July 16, 2025 in Machine Learning Image by Editor In data science and machine learning, raw data is rarely suitable for direct consumption by algorithms. Transforming this data into meaningful, structured inputs that models can learn from is an essential step — this process is known as feature engineering.
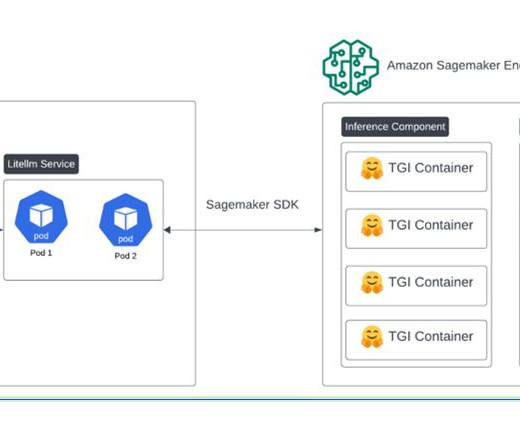
Its also possible to provide custom label tags to help attribute costs to certain usage or departments. For data privacy, you are responsible for your own privacy as a user deploying LiteLLM yourself, but this approach is more secure since the data never leaves your controlled environment except when sent to the LLM providers.
How tall is Mt Everest?”), the goal of IR is to find information relevant to the query from a very large collection of data (e.g., MUVERA: A solution with fixed dimensional encodings MUVERA offers an elegant solution by reducing multi-vector similarity search to single-vector MIPS to make retrieval over complex multi-vector data much faster.
By integrating human annotators with machine learning, SageMaker Ground Truth significantly reduces the cost and time required for datalabeling. To support various labeling needs, SageMaker Ground Truth provides built-in workflows for common tasks like image classification, object detection, and semantic segmentation.
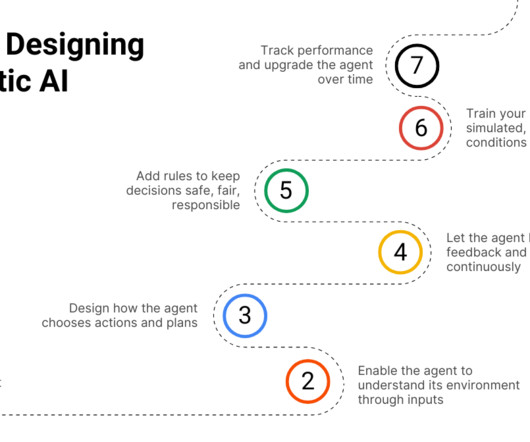
In this blog, we will break down what agentic AI is, how it works, where its being used, and what it means for the future. It takes in data, makes sense of it, and uses that information to plan its next move. For example, a single AI agent can monitor thousands of network endpoints or manage customer service chats around the world.
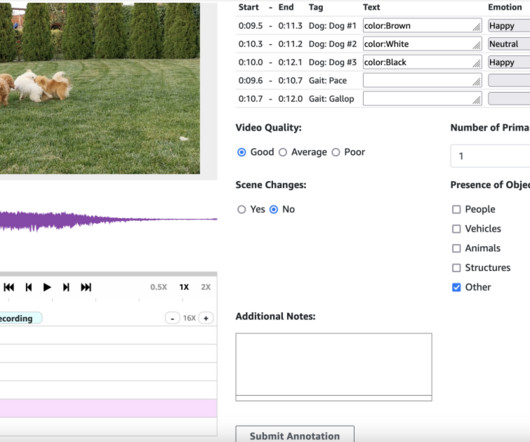
These pairs act as demonstration data for Supervised Fine-Tuning (SFT), teaching models how to respond to similar inputs accurately. In this blog post, we’ll walk you through how to set up these templates in SageMaker to create high-quality datasets for training your large language models. Choose Create labeling job.
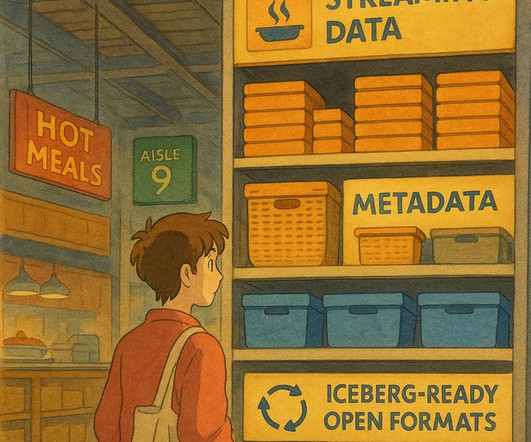
Those dreaded (rather liked) 3-letter acronymsIOT A few years ago, I found myself thinking about how messy IoT data could getfast. I ended up comparing it to a supermarket: different aisles, different types of data, all needing their own shelf space and labelingsystem. Todays data ecosystems are even more complex.
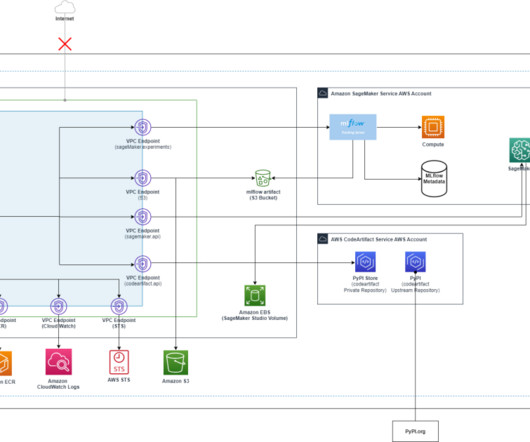
In the initial stages of an ML project, data scientists collaborate closely, sharing experimental results to address business challenges. MLflow , a popular open-source tool, helps data scientists organize, track, and analyze ML and generative AI experiments, making it easier to reproduce and compare results.
By Cornellius Yudha Wijaya , KDnuggets Technical Content Specialist on July 25, 2025 in Data Engineering Image by Editor | ChatGPT # Introduction Machine learning has become an integral part of many companies, and businesses that dont utilize it risk being left behind. Download the data and store it somewhere for now.
But with bibliographic data pouring in faster than ever, we need to address the challenge of keeping records accurate, connected, and accessible at speed. At OCLC, we’ve invested resources into a hybrid approach, leveraging AI to process vast amounts of data while ensuring catalogers and OCLC experts remain at the center of decision-making.
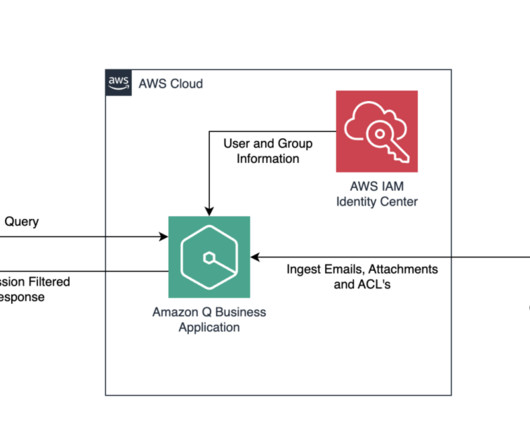
Amazon Q Business is a fully managed, generative AI-powered assistant designed to enhance enterprise operations. It can be tailored to specific business needs by connecting to company data, information, and systems through over 40 built-in connectors.
These large language models (LLMs) are trained on a vast amount of data from various domains and languages. Amazon Augmented AI (Amazon A2I) simplifies the creation of workflows for human review, managing the heavy lifting associated with developing these systems or overseeing a large reviewer workforce.
We recently announced the general availability of cross-account sharing of Amazon SageMaker Model Registry using AWS Resource Access Manager (AWS RAM) , making it easier to securely share and discover machine learning (ML) models across your AWS accounts. The model is finally deployed to production.
This API, which already powers Mistral’s Le Chat chatbot, is designed to classify and manage undesirable text across a variety of safety standards and specific applications. Mistral AI has announced the release of its new content moderation API.
Implementing a cost allocation strategy early is critical for managing your expenses and future optimization activities that will reduce your spend. Implement a tagging strategy A tag is a label you assign to an AWS resource. Tags consist of a customer-defined key and an optional value to help manage, search for, and filter resources.
Since our founding nearly two decades ago, machine learning (ML) and artificial intelligence (AI) have been at the heart of building data-driven products that better match job seekers with the right roles and get people hired. To address these challenges, we used Amazon SageMaker to initiate and manage training jobs efficiently.
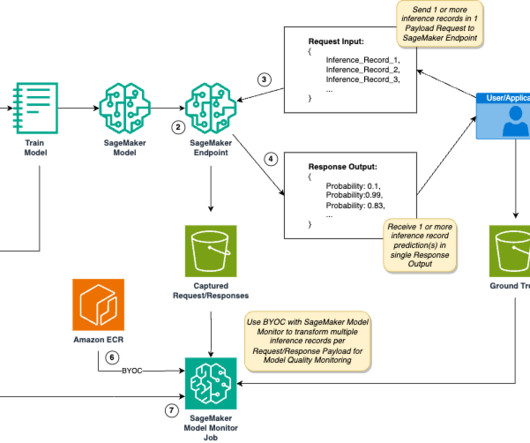
Examples include financial systems processing transaction data streams, recommendation engines processing user activity data, and computer vision models processing video frames. A preprocessor script is a capability of SageMaker Model Monitor to preprocess SageMaker endpoint data capture before creating metrics for model quality.
Concerns about legal implications, accuracy of AI-generated outputs, data privacy, and broader societal impacts have underscored the importance of responsible AI development. This can be useful when you have requirements for sensitive data handling and user privacy.
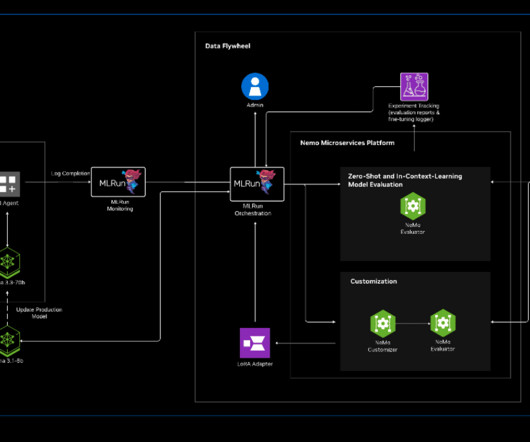
We are proud to announce a new integration between MLRun, the open-source AI orchestration framework, and NVIDIA NeMo microservices, by extending NVIDIA Data Flywheel Blueprint. Read the blog for more details, or go straight to the blueprint to try it out for yourself. What is an AI Data Flywheel? What is MLRun?
It enables you to privately customize the FM of your choice with your data using techniques such as fine-tuning, prompt engineering, and retrieval augmented generation (RAG) and build agents that run tasks using your enterprise systems and data sources while adhering to security and privacy requirements.
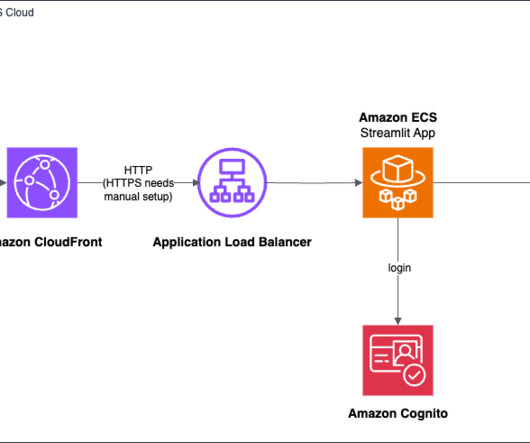
However, as exciting as these advancements are, data scientists often face challenges when it comes to developing UIs and to prototyping and interacting with their business users. Streamlit allows data scientists to create interactive web applications using Python, using their existing skills and knowledge. Choose Manage model access.
Amazon Bedrock is a fully managed service that offers a choice of high-performing foundation models (FMs) along with a broad set of capabilities to build generative AI applications, simplifying development with security, privacy, and responsible AI. No data synthesis techniques are applied.
The experiment tracker can handle large amounts of data, making it well-suited for quick iteration and extensive evaluations of LLM-based applications. While LLMs are powerful, they rely solely on their pre-trained knowledge and lack the ability to fetch current data. Our usage in this blog should be well within the free-tier limits.
These powerful models, trained on vast amounts of data, can generate human-like text, answer questions, and even engage in creative writing tasks. Enter Amazon Bedrock , a fully managed service that provides developers with seamless access to cutting-edge FMs through simple APIs. He is passionate about cloud and machine learning.
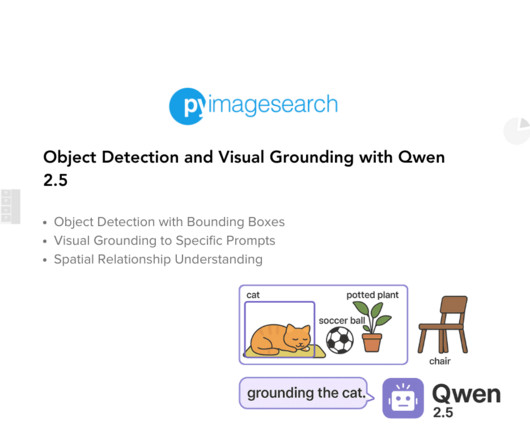
VL Models Prompt Structure Task-Specific Instruction Object or Feature Specification Contextual Clues or Relationships Output Requirements Model Response Format Bounding Box Coordinates (bbox_2d or point_2d) Primary Label (label), Sub-Labels, and Descriptions Hands-on with Qwen 2.5 model series excels (i.e.,
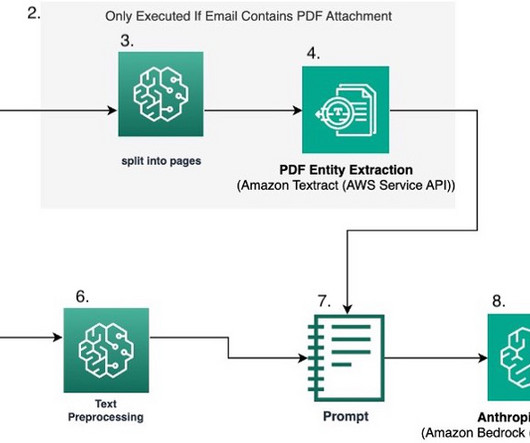
This is a guest blog post co-written with Jordan Knight, Sara Reynolds, George Lee from Travelers. Increasingly, FMs are completing tasks that were previously solved by supervised learning, which is a subset of machine learning (ML) that involves training algorithms using a labeled dataset. The PDF is split into individual pages.
The system then quickly analyzes data from many phones to confirm that an earthquake is happening and estimate its location and magnitude. To receive alerts, users must have Wi-Fi and/or cellular data connectivity, and both Android Earthquake Alerts and location settings enabled.
Traditional ML models often rely on centralized data aggregation, which raises concerns about data security and regulatory constraints. Traditional fraud models often rely on isolated data, leading to overfitting and poor real-world performance. Data privacy laws like GDPR and CCPA further limit collaboration.
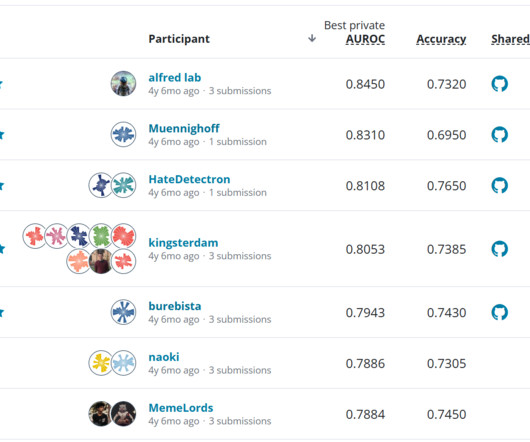
They want to benchmark the level of performance that can be achieved with their data. An ensemble of the top solutions was able to push the state-of-the-art on unseen data, reducing error by 30% compared with the National Centers for Environmental Information (NCEI) benchmark model. But what happens next?
Amazon SageMaker Ground Truth is a powerful datalabeling service offered by AWS that provides a comprehensive and scalable platform for labeling various types of data, including text, images, videos, and 3D point clouds, using a diverse workforce of human annotators. Each batch is made up of data objects to be labeled.
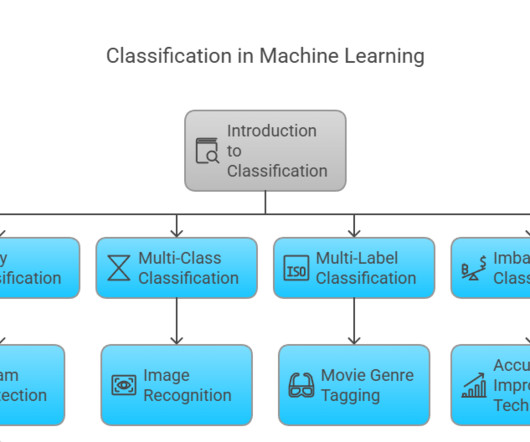
Summary: Classifier in Machine Learning involves categorizing data into predefined classes using algorithms like Logistic Regression and Decision Trees. Introduction Machine Learning has revolutionized how we process and analyse data, enabling systems to learn patterns and make predictions.
We organize all of the trending information in your field so you don't have to. Join 17,000+ users and stay up to date on the latest articles your peers are reading.
You know about us, now we want to get to know you!
Let's personalize your content
Let's get even more personalized
We recognize your account from another site in our network, please click 'Send Email' below to continue with verifying your account and setting a password.


Let's personalize your content