This site uses cookies to improve your experience. To help us insure we adhere to various privacy regulations, please select your country/region of residence. If you do not select a country, we will assume you are from the United States. Select your Cookie Settings or view our Privacy Policy and Terms of Use.
Cookie Settings
Cookies and similar technologies are used on this website for proper function of the website, for tracking performance analytics and for marketing purposes. We and some of our third-party providers may use cookie data for various purposes. Please review the cookie settings below and choose your preference.
Used for the proper function of the website
Used for monitoring website traffic and interactions
Cookie Settings
Cookies and similar technologies are used on this website for proper function of the website, for tracking performance analytics and for marketing purposes. We and some of our third-party providers may use cookie data for various purposes. Please review the cookie settings below and choose your preference.
Strictly Necessary: Used for the proper function of the website
Performance/Analytics: Used for monitoring website traffic and interactions
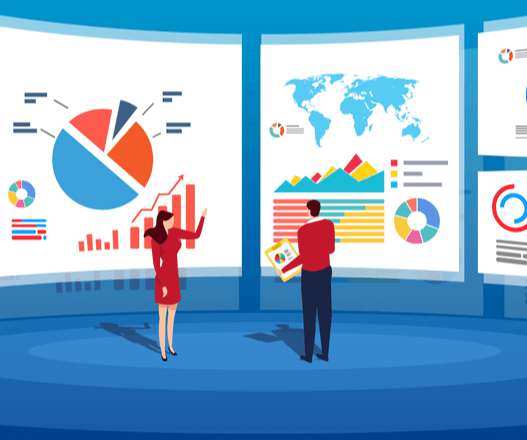
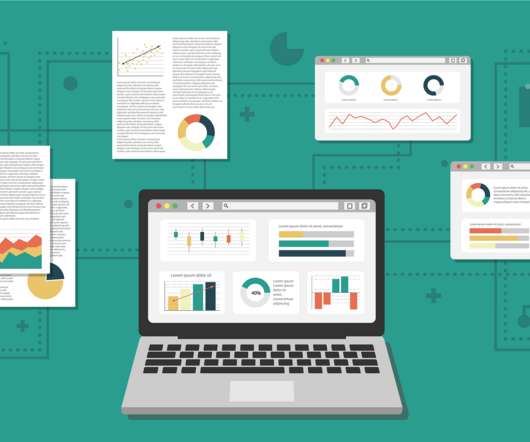
This article was published as a part of the Data Science Blogathon. There has been a debate in the industry between R and Tableau. Let us see this in today’s article. The post Comparing R and Tableau for Data Visualisation appeared first on Analytics Vidhya. Which is better is the question.
Introduction Tableau is a powerful data visualization tool that allows users to analyze and present data interactively and meaningfully. It helps businesses make data-driven decisions by providing easy-to-understand insights and visualizations.
This article was published as a part of the Data Science Blogathon. Introduction With this Tableau tutorial, you’ll learn how to visualize data and derive valuable insights from raw data, making dashboards, reports, tables, and more. Tableau is a […]. Tableau is a […].
ArticleVideo Book This article was published as a part of the Data Science Blogathon. The announcement last week that Tableau’s CEO Adam Selipsky is. The post Is the Tableau Era Coming to an End? appeared first on Analytics Vidhya.
This article was published as a part of the Data Science Blogathon. Introduction There have been many articles online showing how to connect R. The post Integrate R, Tableau and Excel appeared first on Analytics Vidhya.
This article was published as a part of the Data Science Blogathon. Introduction to Tableau Tips! Creating a chart or visual in Tableau is. The post 5 Tableau Tips for Designing a Tidy and Impactful Visualization appeared first on Analytics Vidhya.
This article was published as a part of the Data Science Blogathon Overview Tableau is a well-known data visualization tool widely used in the industry and adopted by major firms like Nike, Coca-Cola, Skype, TCS, Accenture, and various other plethoras of companies both large and small.
Tableau, a dynamic and versatile data visualization tool, has revolutionized how organizations harness the power of their data. In this article, we’ll explore a free course for learning […] The post Free Course on Tableau For Beginners appeared first on Analytics Vidhya.
This article was published as a part of the Data Science Blogathon This article covers all the basic to intermediate concepts and features of Tableau from scratch. This is the perfect article for you if you are an absolute beginner in Tableau.
ArticleVideo Book Note: If you are more interested in learning concepts in an Audio-Visual format, we have this entire article explained in the video. The post Create Dual Axis Charts in Tableau appeared first on Analytics Vidhya.
This article was published as a part of the Data Science Blogathon. The post Customer Segmentation using RFM Analysis in Tableau appeared first on Analytics Vidhya. Introduction Customer segmentation is the process by which we divide customers into groups based on common characteristics like demographics (age, gender, income, etc.),
After all, writing data science articles is from where it all started. The post Top 10 Articles Published in 2021 on Analytics Vidhya appeared first on Analytics Vidhya. Introduction Our long-time followers know how much writing is at the core of this organization. At the end of 2021, we are […].
This article was published as a part of the Data Science Blogathon. Introduction Tableau is a data visualization tool created in Salesforce that allows users to connect to any database, like SQL or MongoDB, and interact freely. The post Most Frequently Asked Tableau Interview Questions appeared first on Analytics Vidhya.
This article was published as a part of the Data Science Blogathon. Introduction on Tableau Hi and welcome to this article. The post A Step by step on Tableau for Beginner appeared first on Analytics Vidhya.
ArticleVideo Book This article was published as a part of the Data Science Blogathon. Introduction Tableau is a powerful Data Visualization software, and much. The post Building a Covid-19 Vaccination Dashboard in Tableau appeared first on Analytics Vidhya.
ArticleVideo Book This article was published as a part of the Data Science Blogathon. The post From Scratch to a Story – Introduction to Tableau (Part 1) appeared first on Analytics Vidhya. Can you tell a story using data? Let us look.
ArticleVideo Book This article was published as a part of the Data Science Blogathon. The post Make Your Tableau Visuals More Effective – Tips And Tricks appeared first on Analytics Vidhya. Introduction Data Visualization is a graphical way to represent data by.
Tableau has been on a long journey to provide natural language interfaces for analytics. We are truly excited about Tableau Pulse , launched in a wide beta in December 2023 and planned for general availability in Tableau 2024.1. In 2020, Metrics in Tableau launched.
ArticleVideo Book This article was published as a part of the Data Science Blogathon. The post Data Preparation for Analysis : Towards Creating your Tableau Dashboard?—?Part Introduction Visual analytics can tell the users the story of data. Part 1 appeared first on Analytics Vidhya.
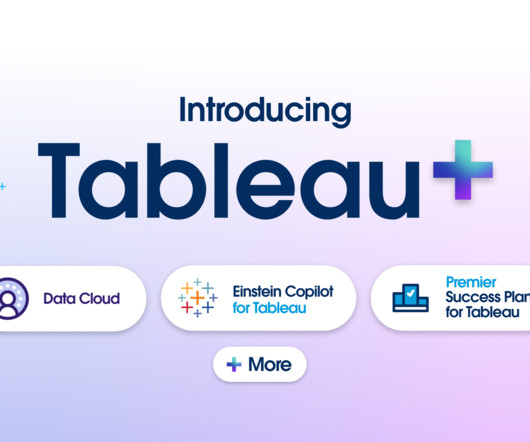
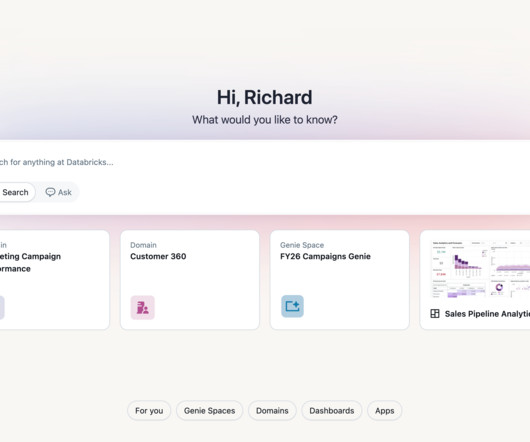
Kristin Adderson June 11, 2024 - 4:53pm Noel Carter Senior Product Marketing Manager, Tableau Evan Slotnick Product Management Director, Tableau At the Tableau Conference 2024 keynote , Tableau CEO Ryan Aytay spoke about the new wave of analytics: the consumerization of data. That’s why we created Tableau+.
Product Manager, Tableau. First thing’s first: I am thrilled to announce that Tableau’s analytics extensions are now available in Tableau Online! Starting with R integration in Tableau 8.3, All of these steps have led up to support for integrating Python, R, and other analytics extensions in Tableau Online.
Product Manager, Tableau. The Extension Gallery that you know and love is now the Tableau Exchange and it has an even greater mission. The Tableau Exchange is your one-stop-shop for offerings to jumpstart your data analysis to answer questions and get actionable data quickly. What are Tableau Accelerators? . Pierce Young.
In this article, we tried to find out the answer to this question and analyze the timeline to see whether it is too early to do this or too late. Tools like Tableau and Power BI do data analysis by just clicking, and they offer amazing visualizations at once, called dashboards. PowerBI or Tableau experiences are a must!
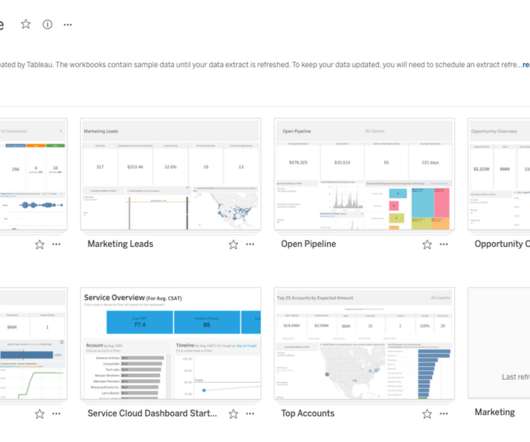
We’ve made it easy to quickly get started in Tableau Online with your Salesforce Org using the new Jumpstart your Salesforce Connection feature. This allows you to sign in to Tableau Online with single sign-on (SSO) using your Salesforce authentication as well as easily publish starter workbooks and data sources using your Salesforce data.
Product Manager, Tableau. The Extension Gallery that you know and love is now the Tableau Exchange and it has an even greater mission. The Tableau Exchange is your one-stop-shop for offerings to jumpstart your data analysis to answer questions and get actionable data quickly. What are Tableau Accelerators? . Pierce Young.
With this concentrated focus, and despite having a job’s market where unemployment rates were sky-high, the Tableau Certification program also reached an all-time high—85% of people who earned a Tableau Certification title got Tableau Certified for the first time. How to become Tableau Certified . As quoted in a U.S.
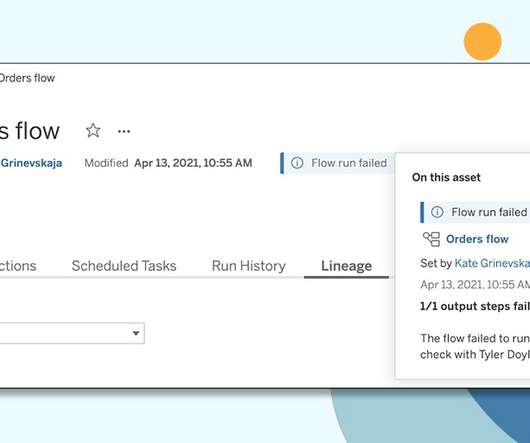
Product Manager, Tableau Prep. Data discovery and trust have been core principles of Tableau Catalog (part of Tableau Data Management ) since its introduction with Tableau 2019.3. Starting with Tableau 2021.1, Kristin Adderson. April 12, 2021 - 10:59pm. April 14, 2021. In 2021.1,
Editor's note: This article originally appeared in Tableau Public. When you want to explore, create, and share data visualizations, we're happy to share that you can start creating vizzes directly from a browser on Tableau Public with the web authoring beta. If you don’t have a Tableau Public profile, create one for free.
With this concentrated focus, and despite having a job’s market where unemployment rates were sky-high, the Tableau Certification program also reached an all-time high—85% of people who earned a Tableau Certification title got Tableau Certified for the first time. How to become Tableau Certified . As quoted in a U.S.
Join now Ready to get started? Get a Demo DATA + AI SUMMIT Data + AI Summit Happening Now Watch the free livestream of the keynotes! The Future of Databricks One This is just the beginning for Databricks One.
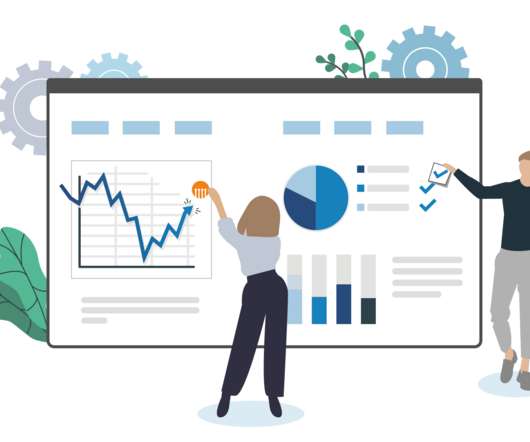
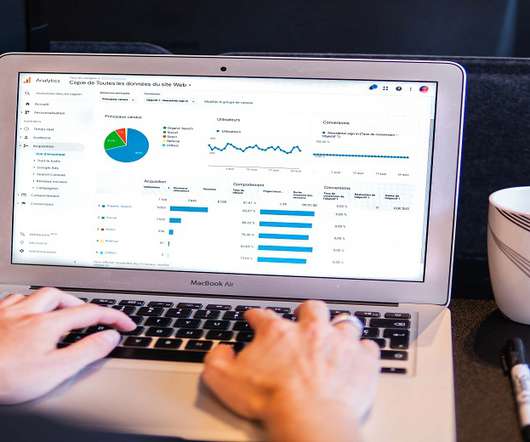
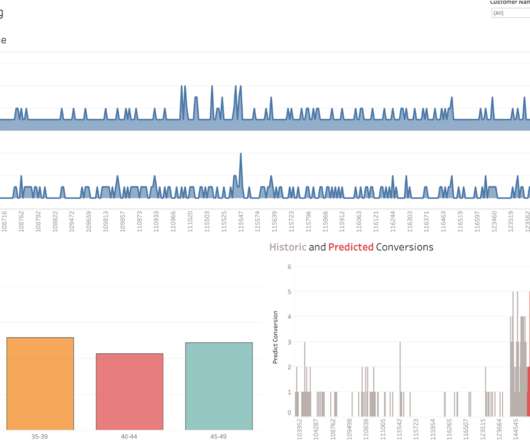
In this article, we’ll explore the art of data visualization and how it can be used to tell compelling stories with business analytics. TableauTableau is a powerful data visualization tool that allows users to connect to a wide range of data sources and create interactive dashboards and visualizations.
Editor's note: This article originally appeared in Vulcan news. After months of searching the sanctuary—a pristine wilderness that’s double the size of Chicago—they pull up their Tableau dashboard. Tableau is designed to make vast amounts of data visible and actionable,” said Neal Myrick, Global Head of Tableau Foundation.
Libraries and Tools: Libraries like Pandas, NumPy, Scikit-learn, Matplotlib, Seaborn, and Tableau are like specialized tools for data analysis, visualization, and machine learning. Tools: Matplotlib, Seaborn, and Tableau are like different mapping tools. Tools: Matplotlib, Seaborn, and Tableau are like different mapping tools.
This article was published as a part of the Data Science Blogathon. Overview In this article, I will share my thoughts on the below. The post Interpreting P-Value and R Squared Score on Real-Time Data – Statistical Data Exploration appeared first on Analytics Vidhya.
Some essential research tools include search engines like Google Scholar, JSTOR, and PubMed, reference management software like Zotero, Mendeley, and EndNote, statistical analysis tools like SPSS, R, and Stata, writing tools like Microsoft Word and Grammarly, and data visualization tools like Tableau and Excel.
This article was published as a part of the Data Science Blogathon Introduction After months of research, development, and clinical trials vaccines for Covid-19 were released to the public. Since then vaccination drives are being run by medical associations and governments across the globe. Countries like UK […].
5 AI stocks to buy in January and hold for the long haul Salesforce and its Agentforce solution Salesforce (CRM -2.77%) has consistently been a leader in customer relationship management (CRM) software, evolving by acquiring companies like Mulesoft, Tableau, and Slack to enhance its offerings in automation and analytics.
This article was published as a part of the Data Science Blogathon. Introduction Data Engineering Tools Data Engineering is a growing sector that’s gaining a lot of attention as new technology creates more and more influx of Big Data. This Data needs to be cleaned, processed, and sorted to actually be able to provide key […].
This article was published as a part of the Data Science Blogathon. Source: Designed by Freepik Introduction We are living in a world where data is collected at every transaction, be it taking a cab ride, online shopping details of what was bought and how much was bought, there are reminders for getting our vehicles […].
Summary: Data Blending in Tableau is helpful in deriving multiple sources to gain comprehensive insights. Through intuitive drag-and-drop functionality, Tableau enables users to blend disparate datasets effortlessly, facilitating holistic data exploration. What is Data Blending in tableau with an example?
To me, Tableau is the only kind of tool that allows me to do data science as an artist. However, there will be no fun if everyone does the same visualization with Tableau. This article is one episode of my series “Make Your Dashboard Stand Out” which provides you with some brilliant but not default visualization ideas.
ArticleVideo Book This article was published as a part of the Data Science Blogathon. Introduction Data visualization is the practice of translating data into. The post Top 10 Data Visualization Tools appeared first on Analytics Vidhya.
Director, Data Science and ML Products, Tableau. First thing’s first: I am thrilled to announce that Tableau’s analytics extensions are now available in Tableau Online! Starting with R integration in Tableau 8.3, Get started with analytics extensions in Tableau Online. Kristin Adderson. February 1, 2021 - 6:58pm.
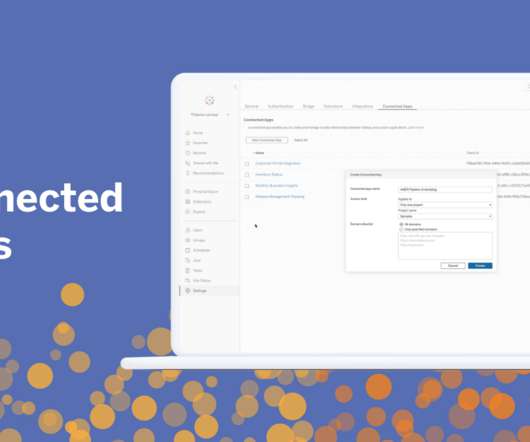
Senior Product Manager, Tableau. We have heard from our customers that a secure, seamless, and easy-to-use authentication method is critical to the success of integrating Tableau analytics. Connected Apps, released in Tableau 2021.4, Connected Apps, released in Tableau 2021.4, Sharon Liao. Bronwen Boyd. January 6, 2022.
We organize all of the trending information in your field so you don't have to. Join 17,000+ users and stay up to date on the latest articles your peers are reading.
You know about us, now we want to get to know you!
Let's personalize your content
Let's get even more personalized
We recognize your account from another site in our network, please click 'Send Email' below to continue with verifying your account and setting a password.


Let's personalize your content