This site uses cookies to improve your experience. To help us insure we adhere to various privacy regulations, please select your country/region of residence. If you do not select a country, we will assume you are from the United States. Select your Cookie Settings or view our Privacy Policy and Terms of Use.
Cookie Settings
Cookies and similar technologies are used on this website for proper function of the website, for tracking performance analytics and for marketing purposes. We and some of our third-party providers may use cookie data for various purposes. Please review the cookie settings below and choose your preference.
Used for the proper function of the website
Used for monitoring website traffic and interactions
Cookie Settings
Cookies and similar technologies are used on this website for proper function of the website, for tracking performance analytics and for marketing purposes. We and some of our third-party providers may use cookie data for various purposes. Please review the cookie settings below and choose your preference.
Strictly Necessary: Used for the proper function of the website
Performance/Analytics: Used for monitoring website traffic and interactions
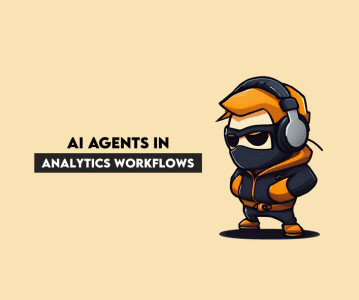
Can this be the end of manual data analytics, or enhance the existing workflow? In this article, we tried to find out the answer to this question and analyze the timeline to see whether it is too early to do this or too late. The past of Data Analytics Data Analytics was not as easy or fast as it is today. And, voila!
This includes duplicate removal, missing value treatment, variable transformation, and normalization of data. Tools like Python (with pandas and NumPy), R, and ETL platforms like Apache NiFi or Talend are used for data preparation before analysis. To know more, read our article on what a Machine Learning engineer is.
The article will also demonstrate the impact of a skilled Business Analyst in driving organizational success. Data visualization tools like Tableau and Power BI can be applied to inform decisions. Ultimately, your expertise in dataanalysis and business strategy propels innovation, minimizes risks, and drives sustainable growth.
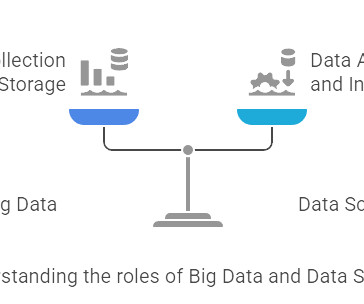
Introduction In today’s hyper-connected world, you hear the terms “Big Data” and “Data Science” thrown around constantly. They pop up in news articles, job descriptions, and tech discussions. What exactly is Big Data? This often takes up a significant chunk of a data scientist’s time.
DataAnalysis and Transition to Machine Learning: Skills: Python, SQL, Excel, Tableau and Power BI are relevant skills for entry-level dataanalysis roles. Next Steps: Transition into data engineering (PySpark, ETL) or machine learning (TensorFlow, PyTorch). However, the competition is high.
Product Manager, Tableau. The Extension Gallery that you know and love is now the Tableau Exchange and it has an even greater mission. The Tableau Exchange is your one-stop-shop for offerings to jumpstart your dataanalysis to answer questions and get actionable data quickly. What are Tableau Accelerators?
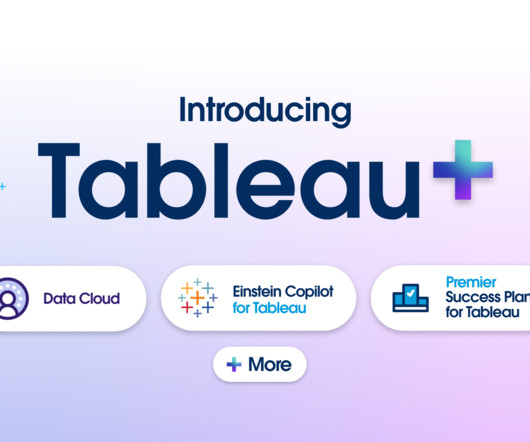
Kristin Adderson June 11, 2024 - 4:53pm Noel Carter Senior Product Marketing Manager, Tableau Evan Slotnick Product Management Director, Tableau At the Tableau Conference 2024 keynote , Tableau CEO Ryan Aytay spoke about the new wave of analytics: the consumerization of data. That’s why we created Tableau+.
Whether you’re a business analyst, data scientist, or marketer, the ability to communicate insights effectively is key to driving business decisions and achieving success. In this article, we’ll explore the art of data visualization and how it can be used to tell compelling stories with business analytics.
Libraries and Tools: Libraries like Pandas, NumPy, Scikit-learn, Matplotlib, Seaborn, and Tableau are like specialized tools for dataanalysis, visualization, and machine learning. Data Cleaning and Preprocessing Before analyzing data, it often needs a cleanup. It’s like deciphering a secret code.
Product Manager, Tableau. The Extension Gallery that you know and love is now the Tableau Exchange and it has an even greater mission. The Tableau Exchange is your one-stop-shop for offerings to jumpstart your dataanalysis to answer questions and get actionable data quickly. What are Tableau Accelerators?
From data collection to dataanalysis and presentation, this blog will cover it all. Google Scholar – Google Scholar is a search engine for scholarly literature, including articles, theses, books, and conference papers. NVivo – Nviva is a software tool for qualitative research and dataanalysis.
It’s like the detective’s toolkit, providing the tools to analyze and interpret data. Think of it as the ability to read between the lines of the data and uncover hidden patterns. DataAnalysis and Interpretation: Data scientists use statistics to understand what the data is telling them.
Generative Visualizations : The AI generates appropriate visualizations based on the user’s query, automatically selecting the best chart types, layouts, and data representations to convey the requested insights. This capability automates much of the manual work traditionally involved in data analytics.
Summary: Data Blending in Tableau is helpful in deriving multiple sources to gain comprehensive insights. It allows analysts to merge datasets seamlessly, leveraging common fields or dimensions for correlation analysis. Understanding the nuances of Data Blending in Tableau is crucial for extracting meaningful insights.
Summary: This article explores different types of DataAnalysis, including descriptive, exploratory, inferential, predictive, diagnostic, and prescriptive analysis. Introduction DataAnalysis transforms raw data into valuable insights that drive informed decisions. What is DataAnalysis?
Director Product Management, Tableau. The Extension Gallery that you know and love is now the Tableau Exchange , and it has an even greater mission. The Tableau Exchange is your one-stop shop for offerings to jumpstart your dataanalysis to answer questions and get actionable data quickly. Blake Johnston.
Summary: Data Visualisation is crucial to ensure effective representation of insights tableau vs power bi are two popular tools for this. This article compares Tableau and Power BI, examining their features, pricing, and suitability for different organisations. What is Tableau? billion in 2023.
In this article, I’ll go through sections of code and describe the starter package you need to ace LangChain. These books can provide valuable insights and knowledge for a data scientist's professional development.2. Laptop: A high-performance laptop is essential for any data scientist. content)>>>1.
Editor's note: This article originally appeared in Forbes. Organizations that rely on dataanalysis to make decisions have a significant competitive advantage in overcoming challenges and planning for the future. In addition, forums moderated by data specialists can become indispensable roundups of solutions.
There are many well-known libraries and platforms for dataanalysis such as Pandas and Tableau, in addition to analytical databases like ClickHouse, MariaDB, Apache Druid, Apache Pinot, Google BigQuery, Amazon RedShift, etc. These tools will help make your initial data exploration process easy.
Editor’s note: This article originally appeared on CIO.com. If we asked you, “What does your organization need to help more employees be data-driven?” where would “better data governance” land on your list? We’ll share how we’re doing this internally at Tableau, focusing on three key areas of understanding and action.
Editor’s note: This article originally appeared on CIO.com. If we asked you, “What does your organization need to help more employees be data-driven?” where would “better data governance” land on your list? We’ll share how we’re doing this internally at Tableau, focusing on three key areas of understanding and action.
Editor's note: This article originally appeared in Forbes. It’s now rare to find an executive who doesn't want their organization to be more data driven. Becoming a data-leading company requires not only data and analytics but also a data culture—a way of working that puts data at the heart of every decision.
Tableau: A data visualization tool that helps in creating interactive and shareable dashboards. Benefits: Integrates marketing data with sales and service data for a holistic view of customer interactions. Tableau Features: Allows for the creation of interactive dashboards and visualizations.
Generated with Bing AI Unlocking the power of data doesn't require a data analyst certification; it's a skill accessible to anyone with data access. Grasp the Essence of Your Data Dig deeper than the surface — understand the intricacies of each column and unravel the connections between tables.
Alyssa Jenson November 14, 2023 - 6:59pm Sue Kraemer Senior Data Skills Curriculum Strategy Manager, Tableau Charts are all around us. In today’s world, the ability to swiftly make decisions and act on data is crucial. There are different chart types appropriate for the type of data being presented.
Summary: Power BI alternatives like Tableau, Qlik Sense, and Zoho Analytics provide businesses with tailored DataAnalysis and Visualisation solutions. Selecting the right alternative ensures efficient data-driven decision-making and aligns with your organisation’s goals and budget. billion to USD 54.27
Editor's note: This article originally appeared in Forbes , by Renee MacLeod, Director, Inclusive Marketing. Dataanalysis and data communication are fundamental to the way people and businesses understand concepts, make decisions, and create solutions. Urban Institute, recreated from Tableau dashboard].
Analyzing F1 from a fan and data science perspective could help gain useful insights. This inspired me to write this article and help unravel factors that constructors and drivers should focus on to improve their standings, if not win the World Championship. Remove erroneous values.
Editor's note: This article originally appeared in Forbes , by Renee MacLeod, Director, Inclusive Marketing. . Dataanalysis and data communication are fundamental to the way people and businesses understand concepts, make decisions, and create solutions. . Urban Institute, recreated from Tableau dashboard].
Being able to discover connections between variables and to make quick insights will allow any practitioner to make the most out of the data. Analytics and DataAnalysis Coming in as the 4th most sought-after skill is data analytics, as many data scientists will be expected to do some analysis in their careers.
In this article, you’ll discover: upcoming trends in business intelligence what benefits will BI provide for businesses in 2020 and on? Here we’ve prepared a detailed outline about the future of BI, including main trends, challenges, specifics, BI-as-a-Service, and most promising BI services of today.
Editor's note: This article originally appeared in Forbes. Organizations that rely on dataanalysis to make decisions have a significant competitive advantage in overcoming challenges and planning for the future. In addition, forums moderated by data specialists can become indispensable roundups of solutions.
BI involves using data mining, reporting, and querying techniques to identify key business metrics and KPIs that can help companies make informed decisions. A career path in BI can be a lucrative and rewarding choice for those with interest in dataanalysis and problem-solving. How to become a blockchain maestro?
BI involves using data mining, reporting, and querying techniques to identify key business metrics and KPIs that can help companies make informed decisions. A career path in BI can be a lucrative and rewarding choice for those with interest in dataanalysis and problem-solving. How to become a blockchain maestro?
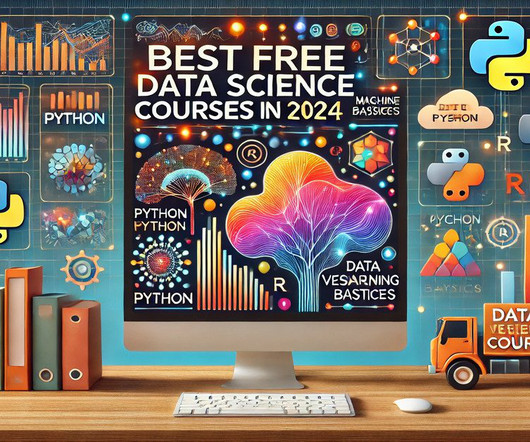
To meet this demand, free Data Science courses offer accessible entry points for learners worldwide. With these courses, anyone can develop essential skills in Python, Machine Learning, and Data Visualisation without financial barriers. A well-rounded curriculum prepares you for practical applications in Data Science.
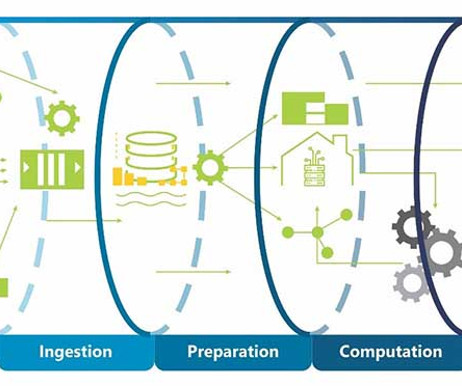
Components of a Big Data Pipeline Data Sources (Collection): Data originates from various sources, such as databases, APIs, and log files. Refer to Unlocking the Power of Big DataArticle to understand the use case of these data collected from various sources.
Whether you’re a business analysing customer behaviour or a researcher conducting a study, the right example of data collection ensures reliable outcomes. Data collection is important because it can provide actionable insights. What Is Data Collection?
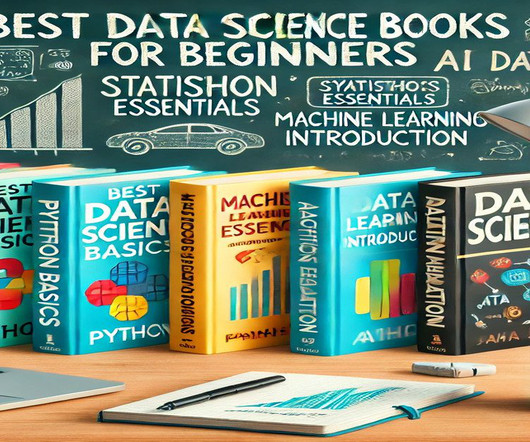
For beginners, choosing the right Data Science books is a crucial first step in building a solid foundation. This article highlights the best Data Science books to kickstart your journey into this transformative field. These features make understanding how Data Science works in actual scenarios easier.
This article is based on a podcast with Adrian. For that, we are using tools like Alation, Tableau and MicroStrategy. And, then, if they need to run a query, they can choose the query that is certified, for example, from the BI team, and then they can continue their analysis through Tableau to obtain their own insights.
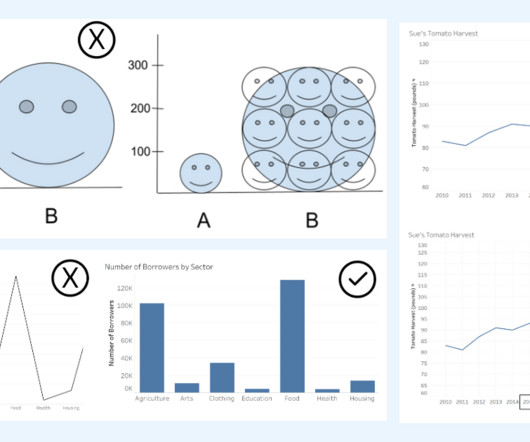
Significance of Data Visualization Data visualization plays a crucial role in dataanalysis and decision-making for several reasons. It is not just about making data look pretty; it’s about unlocking the full potential of data to drive understanding, communication, and action.
So let’s take a look at some of the free data visualization tools available, and how they can provide actionable insights that allow for driving informed decision-making and strategic planning while keeping to being user friendly. What sets Tableau apart is its intuitive, user-friendly, drag-and-drop interface.
This article aims to guide you through the intricacies of Data Analyst interviews, offering valuable insights with a comprehensive list of top questions. Additionally, we’ve got your back if you consider enrolling in the best data analytics courses. Case Study Questions Imagine you have a dataset of customer transactions.
Editor's note: This article originally appeared in Forbes. It’s now rare to find an executive who doesn't want their organization to be more data driven. Becoming a data-leading company requires not only data and analytics but also a data culture—a way of working that puts data at the heart of every decision.
We organize all of the trending information in your field so you don't have to. Join 17,000+ users and stay up to date on the latest articles your peers are reading.
You know about us, now we want to get to know you!
Let's personalize your content
Let's get even more personalized
We recognize your account from another site in our network, please click 'Send Email' below to continue with verifying your account and setting a password.


Let's personalize your content