This site uses cookies to improve your experience. To help us insure we adhere to various privacy regulations, please select your country/region of residence. If you do not select a country, we will assume you are from the United States. Select your Cookie Settings or view our Privacy Policy and Terms of Use.
Cookie Settings
Cookies and similar technologies are used on this website for proper function of the website, for tracking performance analytics and for marketing purposes. We and some of our third-party providers may use cookie data for various purposes. Please review the cookie settings below and choose your preference.
Used for the proper function of the website
Used for monitoring website traffic and interactions
Cookie Settings
Cookies and similar technologies are used on this website for proper function of the website, for tracking performance analytics and for marketing purposes. We and some of our third-party providers may use cookie data for various purposes. Please review the cookie settings below and choose your preference.
Strictly Necessary: Used for the proper function of the website
Performance/Analytics: Used for monitoring website traffic and interactions
PowerBI and Tableau, popular and user-friendly data visualization tools, help businesses organize large datasets. While both software are crucial for efficient data organization, comparing Power […] The post PowerBI vs Tableau: Similarities and Differences appeared first on Analytics Vidhya.
Or regularly build dashboards and visualizations in Tableau or PowerBI? The post Infographic: 11 Steps to Transition into Data Science (for Reporting / MIS / BI Professionals) appeared first on Analytics Vidhya. Introduction Do you often work with reports in Excel? If you answered yes.
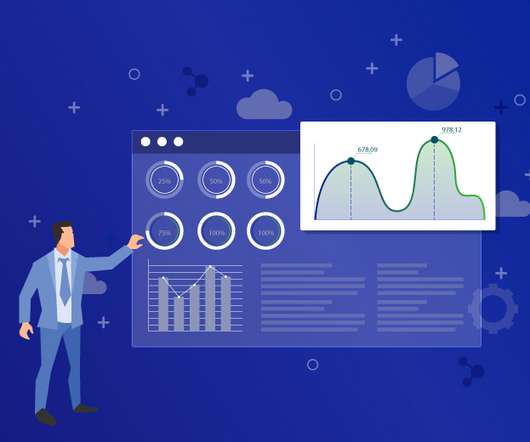
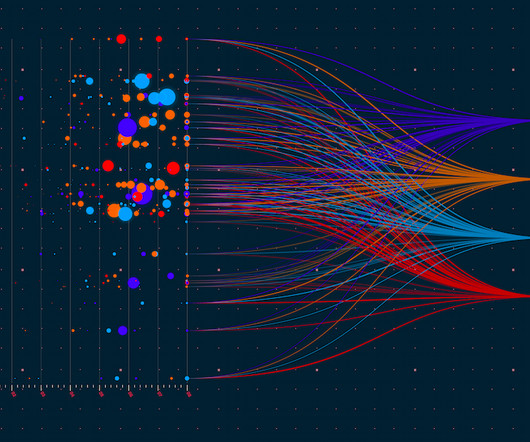
In this article, we’ll explore the art of data visualization and how it can be used to tell compelling stories with business analytics. Data visualization in business analytics Importance of data visualization in business analytics Data visualization is the process of presenting data in a graphical or pictorial format.
Overview Analytics and Business Intelligence provide comprehensible view of the company and derive actionable insights. The post 6 Top Tools for Analytics and Business Intelligence in 2020 appeared first on Analytics Vidhya. We’ll discuss 6 top business intelligence tools that you.
Augmented analytics is revolutionizing how organizations interact with their data. By harnessing the power of machine learning (ML) and natural language processing (NLP), businesses can streamline their data analysis processes and make more informed decisions. What is augmented analytics?
Introduction Introducing Rishabh Dhingra, a dynamic professional making significant strides in Analytics and Data Science within the prestigious realm of Google. Through his innovative mindset […] The post Journeying Through Google’s Analytics and Data Science Domain appeared first on Analytics Vidhya.
Generative AI (GenAI) is stepping in to change the game by making data analytics accessible to everyone. As data keeps growing, tools powered by Generative AI for data analytics are helping businesses and individuals tap into this potential, making decisions faster and smarter.
Descriptive analytics is a fascinating area of data analytics that allows businesses to look back and glean insights from their historical data. This foundational aspect of data analytics is essential for any organization seeking to improve its performance and stay competitive. What is descriptive analytics?
How to Optimize PowerBI and Snowflake for Advanced Analytics Spencer Baucke May 25, 2023 The world of business intelligence and data modernization has never been more competitive than it is today. Much of what is discussed in this guide will assume some level of analytics strategy has been considered and/or defined.
Business analytics is a powerful enabler for organizations seeking to harness the quintessence of information to optimize performance and drive strategic initiatives. What is business analytics? Types of business analytics Business analytics can be categorized into several types, each serving distinct purposes.
Skills and Training Familiarity with ethical frameworks like the IEEE’s Ethically Aligned Design, combined with strong analytical and compliance skills, is essential. Strong analytical skills and the ability to work with large datasets are critical, as is familiarity with data modeling and ETL processes.
BI provides real-time data analysis and performance monitoring, while Data Science enables a deep dive into dependencies in data with data mining and automates decision making with predictive analytics and personalized customer experiences. It offers robust IoT and edge computing capabilities, advanced data analytics, and AI services.
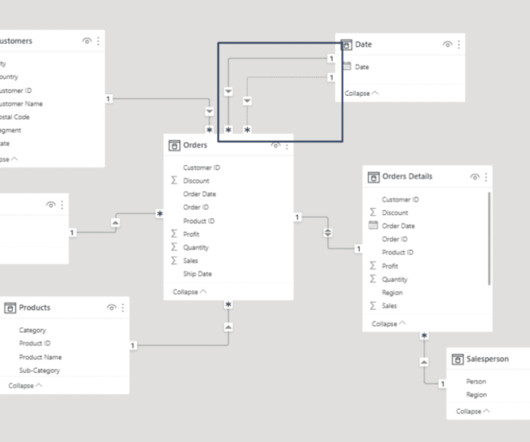
When thinking about PowerBI , the platform’s visuals and report side immediately come to mind. Data modeling in PowerBI has a major impact on the performance of reports and should be considered a substantial learning milestone for new PowerBI developers. Why Does Data Modeling Matter in PowerBI?
It offers full BI-Stack Automation, from source to data warehouse through to frontend. It also supports a wide range of data warehouses, analytical databases, data lakes, frontends, and pipelines/ETL. Frontends : AnalyticsCreator supports PowerBI, Qlik Sense, Tableau, PowerPivot (Excel).
Summary: Data Visualisation is crucial to ensure effective representation of insights tableau vs powerbi are two popular tools for this. This article compares Tableau and PowerBI, examining their features, pricing, and suitability for different organisations. What is Tableau? billion in 2023.
Summary: Business Analytics focuses on interpreting historical data for strategic decisions, while Data Science emphasizes predictive modeling and AI. Introduction In today’s data-driven world, businesses increasingly rely on analytics and insights to drive decisions and gain a competitive edge. What is Business Analytics?
So, to provide our community with the knowledge they need to master these domains, Analytics Vidhya has launched its DataHour sessions. appeared first on Analytics Vidhya. These sessions provide not only theoretical knowledge but also cover practical demonstrations of the […].
It has revolutionized the way businesses approach data analytics by providing cost-effective and customizable solutions that are tailored to specific business needs. Paid BI software often comes with dedicated technical support, which can help businesses troubleshoot any issues and ensure that the software is running smoothly.
Summary: PowerBI alternatives like Tableau, Qlik Sense, and Zoho Analytics provide businesses with tailored Data Analysis and Visualisation solutions. Introduction PowerBI has become one of the most popular business intelligence (BI) tools, offering powerful Data Visualisation, reporting, and decision-making features.
Making sense of data through visualization facilitates informed decision-making across various sectors by simplifying interpretation and improving understanding. […] The post 10 Data Visualization Books appeared first on Analytics Vidhya.
By presenting data visually, organisations can communicate insights more clearly and drive strategic decisions based on real-time analytics. Supports predictive analytics to anticipate market trends and behaviours. Social Media Analytics Platforms like Facebook use Big Data visualization to analyse user engagement metrics.
A data scientist integrates data science techniques with analytical rigor to derive insights that drive action. Analyzing data trends: Using analytic tools to identify significant patterns and insights for business improvement. Data analytics: Identifying trends and patterns to improve business performance.
We’re well past the point of realization that big data and advanced analytics solutions are valuable — just about everyone knows this by now. Data processing is another skill vital to staying relevant in the analytics field. The popular tools, on the other hand, include PowerBI, ETL, IBM Db2, and Teradata.
Though you may encounter the terms “data science” and “data analytics” being used interchangeably in conversations or online, they refer to two distinctly different concepts. Meanwhile, data analytics is the act of examining datasets to extract value and find answers to specific questions.
Summary: Data Blending in Tableau is helpful in deriving multiple sources to gain comprehensive insights. Through intuitive drag-and-drop functionality, Tableau enables users to blend disparate datasets effortlessly, facilitating holistic data exploration. What is Data Blending in tableau with an example?
Summary: Descriptive Analytics tools transform historical data into visual reports, helping businesses identify trends and improve decision-making. Popular tools like PowerBI, Tableau, and Google Data Studio offer unique features for Data Analysis. What is Descriptive Analytics?
Using analytics to bring innovation What is unique about the term data visualization is its design, prerequisites, and features needed to be iterative and exceptional. Designers can get help from some of the best visual tools like Tableau, PowerBI, and more for performing data visualization with ease.
On the same day as Qlik’s roadmap keynote and PowerBI’s Summit in Ireland, Tableau decides to rain on both of those parades. Tableau stole the thunder yesterday with. by Jen Underwood. Read More.
The Event Log Data Model for Process Mining Process Mining as an analytical system can very well be imagined as an iceberg. An object-centric data model is a big deal because it offers the opportunity for a holistic approach and as a database a single source of truth for Process Mining but also for other types of analytical applications.
QGIS, Microsoft's PowerBI, Tableau, and Jupyter notebooks also facilitated many interesting visualizations, particularly for solvers with less programming experience. Nicholas is a Cost Analyst with the Hunatek Professional Services Business Analytics Team, where he works on developing cost models and other analytical products.
Tableau is a data visualisation software helping you to generate graphics-rich reporting and analysing enormous volumes of data. With the help of Tableau, organisations have been able to mine and gather actionable insights from granular sources of data. But What is Tableau for Data Science and what are its advantages and disadvantages?
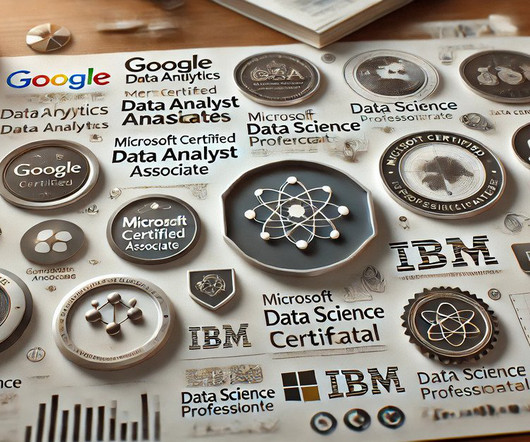
Choosing the right certification enhances career growth and opens doors to better opportunities in Data Analytics. The global Data Analytics market, valued at USD 41.05 Essential Skills for Data Analysts Strong analytical skills top the list of requirements for a Data Analyst.
BI tools can help you gather information better and faster. They can be your 24/7 analytical team that does not practically need any maintenance. BI tools automate all your analytics for you so that you can spend all of those hours on first-priority tasks. Zoho Analytics. SAP Analytics Cloud.
Tableau can help! By leveraging Tableau for Data Analyst can boost efficiency, communicate clearly, uncover hidden patterns, and make data-driven decisions. Mastering Tableau elevates an analyst’s value and unlocks career opportunities. Mastering Tableau elevates an analyst’s value and unlocks career opportunities.
Summary: Use these Business Analyst interview questions to highlight your analytical expertise, stakeholder management, and agile methodologies. By reading further, you will learn how to confidently answer interview queries, highlight your analytical skills, and convey your ability to streamline business processes. billion in 2024.
Visualization libraries available in Python such as Matplotlib and Seaborn, and tools like Tableau and PowerBI become crucial to telling stories that lead to insights. Their job is to ensure that data is made available, trusted, and organizedall of which are required for any analytics or machine-learning task.
Introduction In the rapidly evolving landscape of data analytics, Business Intelligence (BI) tools have become indispensable for organizations seeking to leverage their big data stores for strategic decision-making. Looker focuses on providing user-friendly interfaces with an emphasis on collaboration and self-service analytics.
The current BI trends show that in the future, the BI software will be more accessible, so that even non-techie workers will rely on data insights in their working routine. This shows why self-service BI is on the rise. Prescriptive Analytics. Automation & Augmented Analytics. SAP Lumira.
More and more often, businesses are using data to drive their decisions — which makes cutting-edge analytics and business intelligence strategies one of the best advantages a company can have. Predictive Business Analytics. The Growing BI Analyst Shortage.
This article will serve as an ultimate guide to choosing between Data Science and Data Analytics. Some individuals are confused about the right path to choose between the two lucrative careers — Data Science and Data Analytics. Experience with visualization tools like; Tableau and PowerBI.
Here are some of the best data preprocessing tools of 2023: Microsoft PowerBITableau Trifacta Talend Toad Data Point Power Query Microsoft PowerBI Microsoft PowerBI is a comprehensive data preparation tool that allows users to create reports with multiple complex data sources.
To maximize the potential of this data, businesses need to focus on creating a modern analytics environment that prioritizes both technology and the skills of their employees. This is important regardless of the size of the organization, as a well-defined analytics strategy can lead to significant growth opportunities.
Summary: “Data Science in a Cloud World” highlights how cloud computing transforms Data Science by providing scalable, cost-effective solutions for big data, Machine Learning, and real-time analytics. Centralised access enhances teamwork and accelerates analytics projects.
In this blog post, we’ll explore some of these advanced techniques and how they can be used to enhance analytical capabilities. Tools like Tableau, PowerBI, and D3.js js offer robust capabilities for creating interactive visualizations that provide a more immersive analytics experience.
We organize all of the trending information in your field so you don't have to. Join 17,000+ users and stay up to date on the latest articles your peers are reading.
You know about us, now we want to get to know you!
Let's personalize your content
Let's get even more personalized
We recognize your account from another site in our network, please click 'Send Email' below to continue with verifying your account and setting a password.


Let's personalize your content