article thumbnail

Top 10 Tableau Alternatives to Explore in 2024

Analytics Vidhya

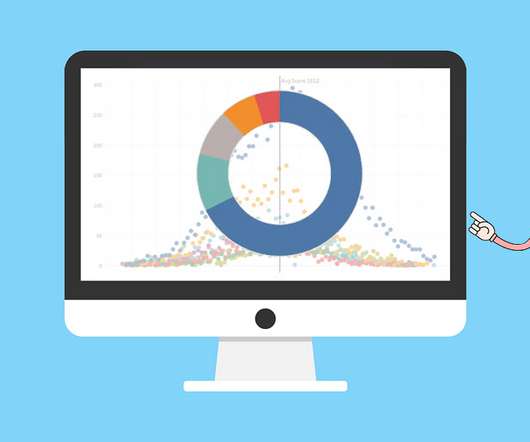
Introduction While Tableau remains a popular choice for data visualization, its dominance is waning. The increasing importance of data analysis across industries has fueled the demand for versatile tools, leading to a surge in Tableau alternatives.

Tableau 281
article thumbnail

Free Course on Tableau For Beginners

Analytics Vidhya

Introduction In the world of data analytics, where every piece of information holds untapped potential, the ability to transform raw data into actionable insights is a game-changer. Tableau, a dynamic and versatile data visualization tool, has revolutionized how organizations harness the power of their data.

Tableau 271
professionals

Sign Up for our Newsletter

This site is protected by reCAPTCHA and the Google Privacy Policy and Terms of Service apply.

article thumbnail

4 AI Features of Tableau that you must Explore

Analytics Vidhya

Introduction Tableau, a powerful data visualization tool, can sometimes leave users with lingering questions. What’s the best way to display this data? Tableau tackles these issues head-on by leveraging artificial intelligence. Am I missing any key insights?

Tableau 237
article thumbnail

25+ Tableau Interview Questions

Analytics Vidhya

Introduction Tableau is a powerful data visualization tool that allows users to analyze and present data interactively and meaningfully. It helps businesses make data-driven decisions by providing easy-to-understand insights and visualizations.

Tableau 306
article thumbnail

Monetizing Analytics Features: Why Data Visualizations Will Never Be Enough

Think your customers will pay more for data visualizations in your application? But today, dashboards and visualizations have become table stakes. Discover which features will differentiate your application and maximize the ROI of your embedded analytics. Brought to you by Logi Analytics.

article thumbnail

What is Tableau? Its Application and Benefits in Data Science

Analytics Vidhya

Introduction Tableau is a powerful data visualization tool that is crucial in Data Science. Its significance lies in its ability to transform complex data into easily understandable visualizations, aiding in better decision-making processes.

Tableau 308
article thumbnail

A Complete Guide To Tableau For Beginners in Data Visualization

Analytics Vidhya

This article was published as a part of the Data Science Blogathon Overview Tableau is a well-known data visualization tool widely used in the industry and adopted by major firms like Nike, Coca-Cola, Skype, TCS, Accenture, and various other plethoras of companies both large and small.