This site uses cookies to improve your experience. To help us insure we adhere to various privacy regulations, please select your country/region of residence. If you do not select a country, we will assume you are from the United States. Select your Cookie Settings or view our Privacy Policy and Terms of Use.
Cookie Settings
Cookies and similar technologies are used on this website for proper function of the website, for tracking performance analytics and for marketing purposes. We and some of our third-party providers may use cookie data for various purposes. Please review the cookie settings below and choose your preference.
Used for the proper function of the website
Used for monitoring website traffic and interactions
Cookie Settings
Cookies and similar technologies are used on this website for proper function of the website, for tracking performance analytics and for marketing purposes. We and some of our third-party providers may use cookie data for various purposes. Please review the cookie settings below and choose your preference.
Strictly Necessary: Used for the proper function of the website
Performance/Analytics: Used for monitoring website traffic and interactions
Generative AI (GenAI) is stepping in to change the game by making data analytics accessible to everyone. As data keeps growing, tools powered by Generative AI for data analytics are helping businesses and individuals tap into this potential, making decisions faster and smarter.
BI provides real-time data analysis and performance monitoring, while Data Science enables a deep dive into dependencies in data with data mining and automates decision making with predictiveanalytics and personalized customer experiences.
Summary : Microsoft Fabric is an end-to-end Data Analytics platform designed for integration, processing, and advanced insights, while PowerBI excels in creating interactive visualisations and reports. Key Takeaways Microsoft Fabric is a full-scale data platform, while PowerBI focuses on visualising insights.
Summary: This blog dives into the most promising PowerBI projects, exploring advanced data visualization, AI integration, IoT & blockchain analytics, and emerging technologies. But what truly sets PowerBI projects apart? PowerBI projects go beyond simply creating reports.
Summary: PowerBI is a business intelligence tool that transforms raw data into actionable insights. PowerBI enhances decision-making by providing interactive dashboards and reports that are accessible to both technical and non-technical users. What Is PowerBI?
Summary: PowerBI alternatives like Tableau, Qlik Sense, and Zoho Analytics provide businesses with tailored Data Analysis and Visualisation solutions. Introduction PowerBI has become one of the most popular business intelligence (BI) tools, offering powerful Data Visualisation, reporting, and decision-making features.
They need a more comprehensive analytics strategy to achieve these business goals. For years, spreadsheet programs like Microsoft Excel, Google sheet, and more sophisticated programs like Microsoft PowerBI have been the primary tools for data analysis. Predictiveanalytics. Explainable AI.
More and more often, businesses are using data to drive their decisions — which makes cutting-edge analytics and business intelligence strategies one of the best advantages a company can have. AI-Powered Big Data Technology. Predictive Business Analytics. Natural Language Processing and Report Generation.
It’s able to support significantly larger datasets than traditional spreadsheets, allows you to do machine learning and AIanalytics, and provides infinite opportunities for customization. They also have led to a number of opportunities with predictiveanalytics. Ownership and flexibility.
Predictive modeling in business analyticsPredictive modeling plays a critical role in business analytics by: Statistical scoring: Utilizing databases for real-time decision-making support. AI integration: Employing artificial intelligence for automation in response to unexpected events.
Supports predictiveanalytics to anticipate market trends and behaviours. Microsoft PowerBIPowerBI is a business analytics service by Microsoft that provides interactive visualizations and business intelligence capabilities with an interface simple enough for end users to create their own reports and dashboards.
AI algorithms play a crucial role in decision intelligence. Rule-based systems, optimization techniques, or probabilistic frameworks are employed to guide decision-making based on the insights gained from data analysis and AI algorithms. How does decision intelligence work?
In addition to Business Intelligence (BI), Process Mining is no longer a new phenomenon, but almost all larger companies are conducting this data-driven process analysis in their organization. This aspect can be applied well to Process Mining, hand in hand with BI and AI. Click to enlarge!
Visualization libraries available in Python such as Matplotlib and Seaborn, and tools like Tableau and PowerBI become crucial to telling stories that lead to insights. Meanwhile, machine learning engineers specialize in developing, deploying, and optimizing AI models for real applications.
Summary: AI is revolutionising the way we use spreadsheet software like Excel. By integrating AI capabilities, Excel can now automate Data Analysis, generate insights, and even create visualisations with minimal human intervention. What is AI in Excel? You can automatically clean, organise, and analyse large datasets with AI.
Overview: Data science vs data analytics Think of data science as the overarching umbrella that covers a wide range of tasks performed to find patterns in large datasets, structure data for use, train machine learning models and develop artificial intelligence (AI) applications.
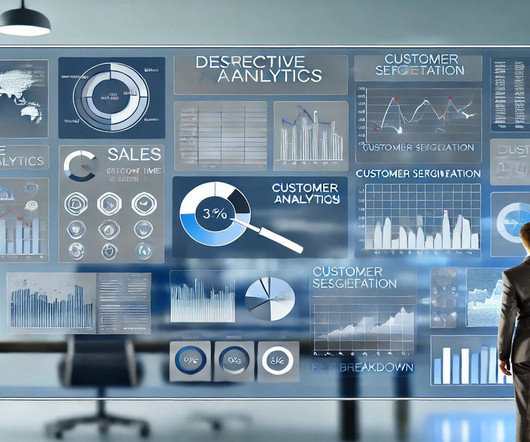
Summary: Descriptive Analytics tools transform historical data into visual reports, helping businesses identify trends and improve decision-making. Popular tools like PowerBI, Tableau, and Google Data Studio offer unique features for Data Analysis. Additionally, reporting is a crucial element of Descriptive Analytics.
Using tools like PowerBI, Tableau, and Grafana, organisations can analyse real-time IoT data, optimise operations, and enhance decision-making while addressing security, scalability, and visualisation challenges. Real-time dashboards and analytics enhance industry monitoring, efficiency, and predictive capabilities.
Their roles now include using advanced technologies like AI and automation. Expertise in tools like PowerBI, SQL, and Python is crucial. AI and automation play a central role in the evolving role. Emerging tools for data analytics and process management are revolutionising how analysts perform their tasks.
Microsoft PowerBI Microsoft PowerBI integrates with various Microsoft products and offers robust reporting features. It is widely used by organizations such as Coca-Cola, which utilizes PowerBI to streamline its sales processes by analysing customer purchase trends and inventory levels.
PredictiveAnalyticsPredictiveanalytics involves using statistical algorithms and Machine Learning techniques to forecast future events based on historical data. It analyses patterns to predict trends, customer behaviours, and potential outcomes.
Summary: The future of Data Science is shaped by emerging trends such as advanced AI and Machine Learning, augmented analytics, and automated processes. Key Takeaways AI and Machine Learning will advance significantly, enhancing predictive capabilities across industries. Here are five key trends to watch.
Summary: The difference between Data Science and Data Analytics lies in their approachData Science uses AI and Machine Learning for predictions, while Data Analytics focuses on analysing past trends. Data Science requires advanced coding, whereas Data Analytics relies on statistical methods. What is Data Science?
Analytics Tools Once data is stored and processed, analytics tools help organisations extract valuable insights.Analytics tools play a critical role in transforming raw data into actionable insights. Machine Learning Algorithms: These algorithms can identify patterns in data and make predictions based on historical trends.
Analytics Tools Once data is stored and processed, analytics tools help organisations extract valuable insights.Analytics tools play a critical role in transforming raw data into actionable insights. Machine Learning Algorithms: These algorithms can identify patterns in data and make predictions based on historical trends.
There are three main types, each serving a distinct purpose: Descriptive Analytics (Business Intelligence): This focuses on understanding what happened. ” PredictiveAnalytics (Machine Learning): This uses historical data to predict future outcomes. ” or “What are our customer demographics?”
Here are steps you can follow to pursue a career as a BI Developer: Acquire a solid foundation in data and analytics: Start by building a strong understanding of data concepts, relational databases, SQL (Structured Query Language), and data modeling. Is business intelligence part of AI?
Predictiveanalytics and modeling: With Tableau’s integration with statistical tools, you can build predictive models using techniques like regression, classification, clustering, and time series analysis. Accordingly, Tableau Data Scientist salary is generally more than those experts having specialisation in PowerBI.
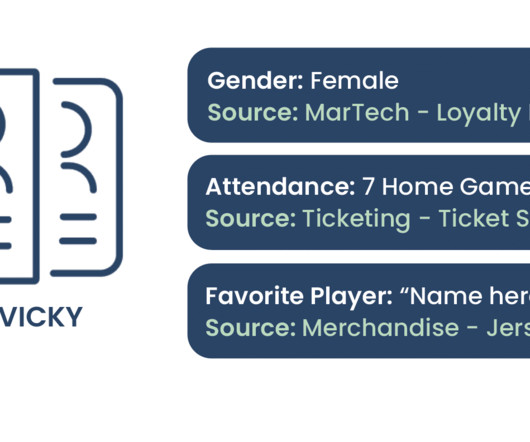
Step 2: Analyze the Data Once you have centralized your data, use a business intelligence tool like Sigma Computing , PowerBI , Tableau , or another to craft analytics dashboards. The future of the Fan 360 holds exciting possibilities with the combination of AI and Machine Learning.
Data Analysis At this stage, organizations use various analytical techniques to derive insights from the stored data: Descriptive Analytics: Provides insights into past performance by summarizing historical data. Prescriptive Analytics : Offers recommendations for actions based on predictive models.
Deep Learning Deep learning is a cornerstone of modern AI, and its applications are expanding rapidly. Scikit-learn also earns a top spot thanks to its success with predictiveanalytics and general machine learning. Generative AI Generative AI is making waves in the industry, and skills in this area are increasingly in demand.
It includes AI, Deep Learning, Machine Learning and more. AI and Machine Learning Integration: AI-driven Data Science powers industries like healthcare, e-commerce, and entertainment34. Automation, ethical AI, and quantum computing will shape Data Science by 2025. What Is Data Science?
Through predictiveanalytics, machine learning, and big data, healthcare providers can make data-driven decisions to improve outcomes, efficiency, and overall patient experiences. PredictiveAnalytics for Disease Prevention Predictiveanalytics is a powerful tool in the arsenal of healthcare Data Scientists.
Moreover, its ability to integrate seamlessly with Microsoft tools (Office 365, Teams, PowerBI) and third-party applications makes collaboration and data access much easier. Moreover, integration with PowerBI provides advanced reporting capabilities, offering visual insights into financial metrics.
We organize all of the trending information in your field so you don't have to. Join 17,000+ users and stay up to date on the latest articles your peers are reading.
You know about us, now we want to get to know you!
Let's personalize your content
Let's get even more personalized
We recognize your account from another site in our network, please click 'Send Email' below to continue with verifying your account and setting a password.


Let's personalize your content