This site uses cookies to improve your experience. To help us insure we adhere to various privacy regulations, please select your country/region of residence. If you do not select a country, we will assume you are from the United States. Select your Cookie Settings or view our Privacy Policy and Terms of Use.
Cookie Settings
Cookies and similar technologies are used on this website for proper function of the website, for tracking performance analytics and for marketing purposes. We and some of our third-party providers may use cookie data for various purposes. Please review the cookie settings below and choose your preference.
Used for the proper function of the website
Used for monitoring website traffic and interactions
Cookie Settings
Cookies and similar technologies are used on this website for proper function of the website, for tracking performance analytics and for marketing purposes. We and some of our third-party providers may use cookie data for various purposes. Please review the cookie settings below and choose your preference.
Strictly Necessary: Used for the proper function of the website
Performance/Analytics: Used for monitoring website traffic and interactions
Unlock the potential of your data with Databricks' AI/BI Genie spaces! This blog post explores how to create a Genie space using a World of Warcraft dataset, enabling users to interactively query data and gain insights like a data analyst.
Summary: This PowerBI DAX tutorial introduces beginners to the fundamentals of Data Analysis Expressions, including syntax, functions, and context. Introduction In the world of Business Intelligence , PowerBI is a leading tool for Data Analysis and visualization. What is DAX?
PowerBI proves to be the best tool for analysis and visualization of data. Cloud-based PowerBI technology is a forerunner for corporate executives. It constitutes different versions like PowerBI Desktop, an online PowerBI service as SaaS, PowerBI apps for Windows, Android and iOS.
Summary: Data Visualization with PowerBI enhances decision-making by transforming raw data into compelling visuals. Learn PowerBI and other essential tools with Pickl.AIs free course, which is available with certification and a job guarantee. In fact, PowerBI is leading the pack with a 13.42% market share.
Generative AI (GenAI) is stepping in to change the game by making data analytics accessible to everyone. As data keeps growing, tools powered by Generative AI for data analytics are helping businesses and individuals tap into this potential, making decisions faster and smarter.
Microsoft Fabric combines multiple elements into a single platform – Image courtesy of Microsoft The contribution of PowerBI The integration of Microsoft PowerBI and Microsoft Fabric offers a powerful combination for organizations seeking comprehensive data analytics and insights.
His vision is to build an AI product using a graph neural network for students struggling with mental illness. Currently, he is focusing on content creation and writing technical blogs on machine learning and data science technologies.
Summary : Microsoft Fabric is an end-to-end Data Analytics platform designed for integration, processing, and advanced insights, while PowerBI excels in creating interactive visualisations and reports. Key Takeaways Microsoft Fabric is a full-scale data platform, while PowerBI focuses on visualising insights.
According to Google AI, they work on projects that may not have immediate commercial applications but push the boundaries of AI research. With the continuous growth in AI, demand for remote data science jobs is set to rise. Specialists in this role help organizations ensure compliance with regulations and ethical standards.
Blog Top Posts About Topics AI Career Advice Computer Vision Data Engineering Data Science Language Models Machine Learning MLOps NLP Programming Python SQL Datasets Events Resources Cheat Sheets Recommendations Tech Briefs Advertise Join Newsletter 5 Error Handling Patterns in Python (Beyond Try-Except) Stop letting errors crash your app.
Summary: This blog dives into the most promising PowerBI projects, exploring advanced data visualization, AI integration, IoT & blockchain analytics, and emerging technologies. Introduction to PowerBI Project s The world of Data Analysis is constantly evolving, and PowerBI stands at the forefront of this transformation.
Summary: PowerBI is a business intelligence tool that transforms raw data into actionable insights. PowerBI enhances decision-making by providing interactive dashboards and reports that are accessible to both technical and non-technical users. What Is PowerBI?
In this blog, we will unfold the benefits of PowerBI and key PowerBI features , along with other details. What is PowerBI? PowerBI is loaded with features that help in making data-driven decisions. Here comes the role of PowerBI. billion by 2028.
Summary: PowerBI dashboards transform complex data into actionable insights, enabling organizations to make informed decisions quickly. By using powerbi dashboard examples, businesses can can apply effective design principles to enhance collaboration and operational efficiency.
Summary: In PowerBI, slicers and filters serve distinct purposes. PowerBI has emerged as a leading tool for data visualisation and business intelligence, allowing users to transform raw data into actionable insights. What are Slicers in PowerBI? What are Filters in PowerBI?
Summary: PowerBI alternatives like Tableau, Qlik Sense, and Zoho Analytics provide businesses with tailored Data Analysis and Visualisation solutions. Introduction PowerBI has become one of the most popular business intelligence (BI) tools, offering powerful Data Visualisation, reporting, and decision-making features.
Summary: PowerBI is a business analytics tool transforming data into actionable insights. Key features include AI-powered analytics, extensive data connectivity, customisation options, and robust data modelling. It offers AI-driven analytics, including Natural Language Processing. Why PowerBI?
The Datamarts capability opens endless possibilities for organizations to achieve their data analytics goals on the PowerBI platform. Before we look into the PowerBI Datamarts, let us take a step back and understand the meaning of a Datamart. What is PowerBI Datamarts?
Summary: PowerBI is a leading data analytics platform offering advanced features like real-time analytics and collaborative capabilities. Understanding its significance is vital for aspiring PowerBI developers. Mastering PowerBI can significantly enhance career prospects, given its prevalence in the industry.
Summary: This guide covers visualising KPI in PowerBI, from setting up the tool and preparing data to selecting the right visuals and enhancing dashboards. PowerBI is an excellent tool for this purpose, offering powerful features to create interactive, dynamic visualisations that bring data to life.
Summary: Counting rows is a fundamental task in PowerBI that requires careful consideration. This blog explores how to get total number of rows in power query. Understanding PowerBI and Its Importance PowerBI is a suite of business analytics tools that allows users to analyze data and share insights.
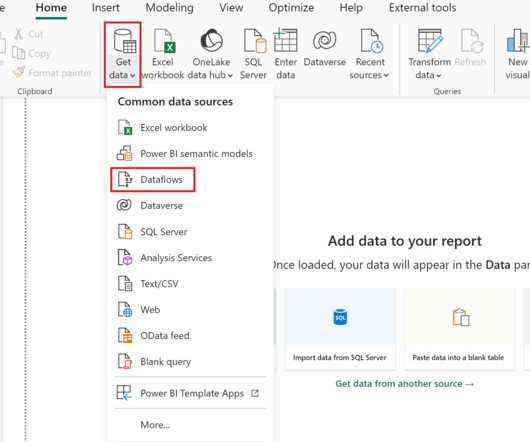
We at phData have written extensively about creating centralized data products in PowerBI. In this blog, we will explain dataflows and their use cases and show an example of how to bring data from Snowflake AI Data Cloud into a dataflow. What are Dataflows, and Why are They So Great?
Summary: Data Visualisation is crucial to ensure effective representation of insights tableau vs powerbi are two popular tools for this. This article compares Tableau and PowerBI, examining their features, pricing, and suitability for different organisations. What is PowerBI? billion in 2023.
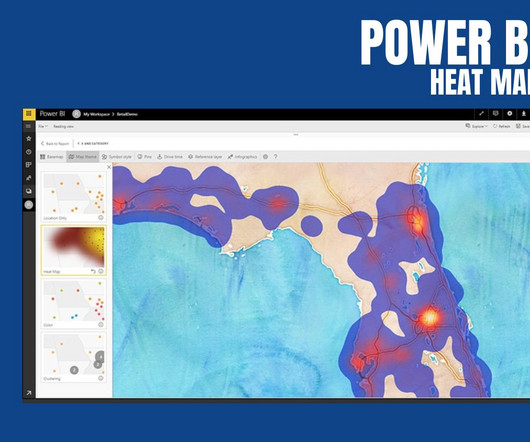
PowerBI Heatmap: Heatmap in PowerBI refers to the type of custom visualisation that businesses analysts utilise for showcasing the relationship between two variables on a map in different colour patches. It helps the user in visualising the patterns which are hidden and observe the changes across each axis.
Summary: This section outlines key mistakes to avoid when creating dynamic visual displays in PowerBI. PowerBI’s Dynamic Visual Displays transform complex datasets into engaging, interactive reports. What are Dynamic Visual Displays in PowerBI? Read More: How to Create a Heatmap in PowerBI?
Driving a data culture is now a lot more — well, driven — thanks to the latest of Alation’s 80+ connectors : PowerBI Scanner, which unifies self-service and enterprise analytics and allows users to find answers fast with industry-leading AI. What Is the Significance of the Alation & PowerBI Partnership?
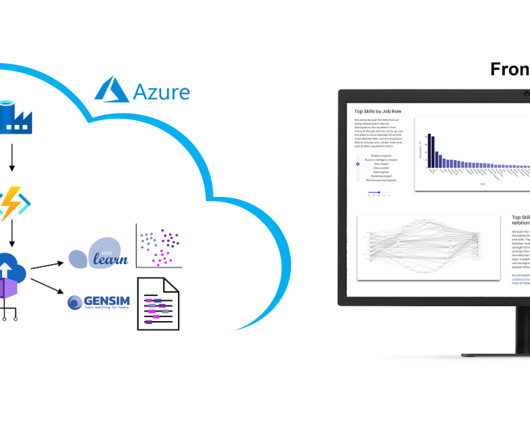
On own account, we from DATANOMIQ have created a web application that monitors data about job postings related to Data & AI from multiple sources (Indeed.com, Google Jobs, Stepstone.de The post Monitoring of Jobskills with Data Engineering & AI appeared first on Data Science Blog. Why we did it?
The problem may occur when you want to import an Excel file in SharePoint to PowerBI. After that, paste the copied path in the URL in PowerBI. Python in PowerBI: [link] PowerBI Tip — How to custom sort categorical/text columns in a bar chart? You should see the .xlsx?web=1
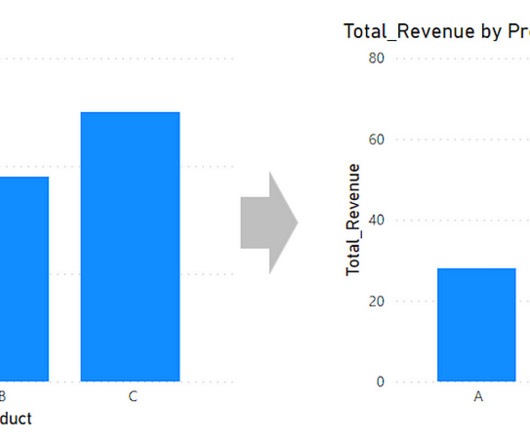
When you’re making bar charts or column charts in PowerBI (a tool for showing data visually), sometimes you want to add a special bar. So, in simpler terms, this message talks about adding a total bar to your charts in PowerBI. Submission Suggestions PowerBI Tip: Create a bar chart with a total bar.
It offers robust IoT and edge computing capabilities, advanced data analytics, and AI services. Data Mesh on Azure Cloud with Databricks and Delta Lake for Applications of Business Intelligence, Data Science and Process Mining.
These are platforms that integrate the field of data analytics with artificial intelligence (AI) and machine learning (ML) solutions. However, unlike the common app stores, this platform is focused on making AI-powered solutions more accessible to different community members. What is OpenAI’s GPT Store?
PyTorch: An open-source machine learning library developed by Facebook’s AI research group. Link to the repository: [link] Looking to begin exploring, analyzing, and visualizing data with PowerBI Desktop? Our Introduction to PowerBI training course is designed to assist you in getting started!
In March 2023, we had the pleasure of hosting the first edition of the Future of Data and AI conference – an incredible tech extravaganza that drew over 10,000 attendees, featured 30+ industry experts as speakers, and offered 20 engaging panels and tutorials led by the talented team at Data Science Dojo.
As Indian companies across industries increasingly embrace data-driven decision-making, artificial intelligence (AI), and automation, the demand for skilled data scientists continues to surge. Data Visualization: Ability to create intuitive visualizations using Matplotlib, Seaborn, Tableau, or PowerBI to convey insights clearly.
Upcoming Online ML/AI Conference, AWS Innovate A free, online conference hosted by Amazon Web Services. Data Drift Monitoring for Azure ML Datasets Azure ML now provides monitoring for when your data changes (called data drift). Courses & Learning. It focuses on using AWS products to solve data science problems.
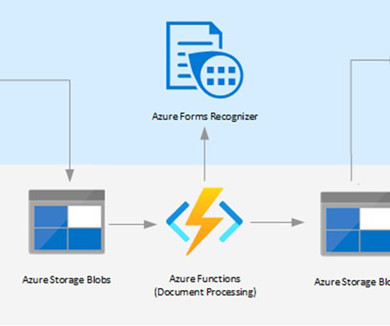
Introduction Intelligent document processing (IDP) is a technology that uses artificial intelligence (AI) and machine learning (ML) to automatically extract information from unstructured documents such as invoices, receipts, and forms.
Summary: The article explores the differences between data driven and AI driven practices. Data-driven and AI-driven approaches have become key in how businesses address challenges, seize opportunities, and shape their strategic directions.
Introduction The world is transforming by AI, ML, Blockchain, and Data Science drastically, and hence its community is growing rapidly. So, to provide our community with the knowledge they need to master these domains, Analytics Vidhya has launched its DataHour sessions.
AI is making it easier than ever to succeed in this growing field. Bloggers are using AI to better identify target customers and create the right content for them. With every year, AI technologies only become stronger and introduce new features. AI is the Key to Driving Growth in Affiliate Marketing. billion by 2022.
Automatic data identification Data extraction methods utilized by AI algorithms allow for the identification of relevant data from a multitude of sources. Data visualization tools Advanced visualization tools like Tableau and Microsoft PowerBI enable users to interpret data through graphical formats.
It’s able to support significantly larger datasets than traditional spreadsheets, allows you to do machine learning and AI analytics, and provides infinite opportunities for customization. Data analytics tools like Alteryx and PowerBI were built to address these usability problems, while also giving users similar power to Python.
Summary: Business Analytics focuses on interpreting historical data for strategic decisions, while Data Science emphasizes predictive modeling and AI. Dashboards, such as those built using Tableau or PowerBI , provide real-time visualizations that help track key performance indicators (KPIs).
AI algorithms play a crucial role in decision intelligence. Rule-based systems, optimization techniques, or probabilistic frameworks are employed to guide decision-making based on the insights gained from data analysis and AI algorithms. How does decision intelligence work?
Microsoft PowerBIPowerBI is a business analytics service by Microsoft that provides interactive visualizations and business intelligence capabilities with an interface simple enough for end users to create their own reports and dashboards. Real-Time Data Monitoring : Allows users to track metrics in real-time.
We organize all of the trending information in your field so you don't have to. Join 17,000+ users and stay up to date on the latest articles your peers are reading.
You know about us, now we want to get to know you!
Let's personalize your content
Let's get even more personalized
We recognize your account from another site in our network, please click 'Send Email' below to continue with verifying your account and setting a password.


Let's personalize your content