This site uses cookies to improve your experience. To help us insure we adhere to various privacy regulations, please select your country/region of residence. If you do not select a country, we will assume you are from the United States. Select your Cookie Settings or view our Privacy Policy and Terms of Use.
Cookie Settings
Cookies and similar technologies are used on this website for proper function of the website, for tracking performance analytics and for marketing purposes. We and some of our third-party providers may use cookie data for various purposes. Please review the cookie settings below and choose your preference.
Used for the proper function of the website
Used for monitoring website traffic and interactions
Cookie Settings
Cookies and similar technologies are used on this website for proper function of the website, for tracking performance analytics and for marketing purposes. We and some of our third-party providers may use cookie data for various purposes. Please review the cookie settings below and choose your preference.
Strictly Necessary: Used for the proper function of the website
Performance/Analytics: Used for monitoring website traffic and interactions
The post Using DataVisualization to Explore the Human Space Race! Since the dawn of civilization, we have mapped constellations, named planets after Gods and so on. We have seen signs and visions in celestial bodies. In the previous century, we finally had the technology to […]. appeared first on Analytics Vidhya.
Blog Top Posts About Topics AI Career Advice Computer Vision Data Engineering Data Science Language Models Machine Learning MLOps NLP Programming Python SQL Datasets Events Resources Cheat Sheets Recommendations Tech Briefs Advertise Join Newsletter Go vs. Python for Modern Data Workflows: Need Help Deciding?
This means that you can use natural language prompts to perform advanced dataanalysis tasks, generate visualizations, and train machine learning models without the need for complex coding knowledge. Data manipulation: You can use the plugin to perform data cleaning, transformation, and feature engineering tasks.
Last Updated on September 8, 2023 by Editorial Team Author(s): Francis Adrian Viernes Originally published on Towards AI. Four Essential Tools Every Data Scientist Should Have in Their Toolbox This member-only story is on us. Photo by Adam Śmigielski on Unsplash It’s a great time to be a data scientist!
These skills include programming languages such as Python and R, statistics and probability, machine learning, datavisualization, and data modeling. Data preparation is an essential step in the data science workflow, and data scientists should be familiar with various data preparation tools and best practices.
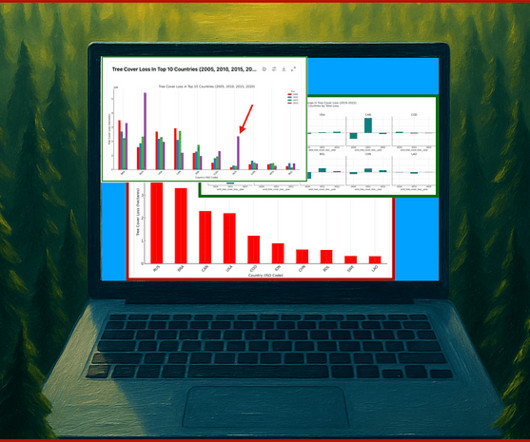
Last Updated on April 23, 2025 by Editorial Team Author(s): John Loewen, PhD Originally published on Towards AI. Exploratoryanalysis and data storytelling on global forest loss Prompting GPT-4 for exploratorydataanalysis and storytelling are an essential tool to add to your data science toolbox.
As artificial intelligence (AI) continues to transform industries—from healthcare and finance to entertainment and education—the demand for professionals who understand its inner workings is skyrocketing. Yet, navigating the world of AI can feel overwhelming, with its complex algorithms, vast datasets, and ever-evolving tools.
Summary: ExploratoryDataAnalysis (EDA) uses visualizations to uncover patterns and trends in your data. Histograms, scatter plots, and charts reveal relationships and outliers, helping you understand your data and make informed decisions. Imagine a vast, uncharted territory – your data set.
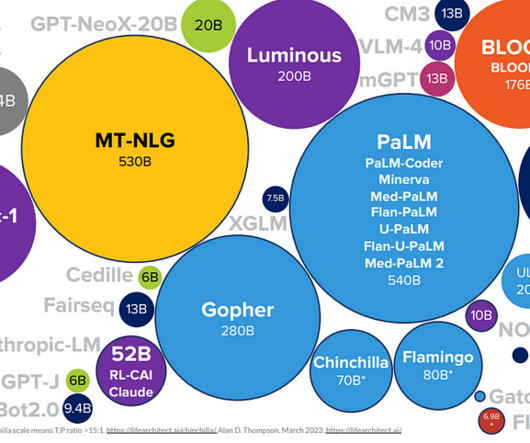
As we delve into 2023, the realms of Data Science, Artificial Intelligence (AI), and Large Language Models (LLMs) continue to evolve at an unprecedented pace. The data sets are categorized according to varying difficulty levels to be suitable for everyone.
The data sets are categorized according to varying difficulty levels to be suitable for everyone. Top 7 Generative AI courses offered online Generative AI is a rapidly growing field with applications in a wide range of industries, from healthcare to entertainment.
Last Updated on January 2, 2024 by Editorial Team Author(s): Youssef Hosni Originally published on Towards AI. Therefore, understanding how to work with it and how to apply analytical and forecasting techniques are critical for every aspiring data scientist. Join thousands of data leaders on the AI newsletter.
While machine learning frameworks and platforms like PyTorch, TensorFlow, and scikit-learn can perform data exploration well, it’s not their primary intent. There are also plenty of datavisualization libraries available that can handle exploration like Plotly, matplotlib, D3, Apache ECharts, Bokeh, etc.
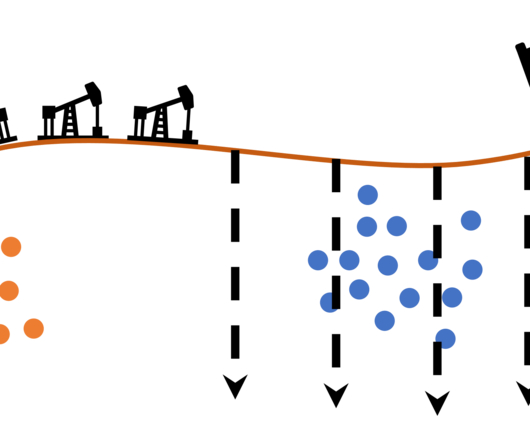
The final point to which the data has to be eventually transferred is a destination. The destination is decided by the use case of the data pipeline. It can be used to run analytical tools and power datavisualization as well. Otherwise, it can also be moved to a storage centre like a data warehouse or lake.
Introduction In 2025, the role of a data scientist remains one of the most sought-after and lucrative career paths in India’s rapidly growing technology and business sectors. Data quality issues are common in Indian datasets, so cleaning and preprocessing are critical.
Author(s): Juliusnyambok Originally published on Towards AI. Figure 3: The required python libraries The problem presented to us is a predictive analysis problem which means that we will be heavily involved in finding patterns and predictions rather than seeking recommendations. ExploratoryDataAnalysis is a pre-study.
Last Updated on August 8, 2024 by Editorial Team Author(s): Gift Ojeabulu Originally published on Towards AI. Because of its interactive features, it’s ideal for learning and teaching, prototypes, exploratorydataanalysis projects, and visualizations.
Summary: DataAnalysis focuses on extracting meaningful insights from raw data using statistical and analytical methods, while datavisualization transforms these insights into visual formats like graphs and charts for better comprehension. Deep Dive: What is DataVisualization?
Data science is analyzing and predicting data, It is an emerging field. Some of the applications of data science are driverless cars, gaming AI, movie recommendations, and shopping recommendations. Since the field covers such a vast array of services, data scientists can find a ton of great opportunities in their field.
Last Updated on March 1, 2023 by Editorial Team Author(s): Fares Sayah Originally published on Towards AI. Through each exercise, you’ll learn important data science skills as well as “best practices” for using pandas. Through each exercise, you’ll learn important data science skills as well as “best practices” for using pandas.
Last Updated on November 1, 2023 by Editorial Team Author(s): Mirza Anandita Originally published on Towards AI. Enhancing The Robustness of Regression Model with Time-Series Analysis — Part 1 A case study on Singapore’s HDB resale prices. Therefore, below is the monthly average price of HDB flats from January 2017 to August 2023.
Imagine data scientists as modern-day detectives who sift through a sea of information to uncover hidden patterns, trends, and correlations that can inform decision-making and drive innovation. Just like sifting through ancient artifacts, they meticulously clean and refine the data, preparing it for the grand unveiling.
The value of AI these days is undeniable. We collect more and more diverse data types, and we’re not always sure how we can turn this data into real value. Or even if we have a pretty good understanding of the problem, there is not enough data to run a successful project and deliver impact back to the business.
Python machine learning packages excel in datavisualization, with libraries like Seaborn and Matplotlib providing powerful capabilities for creating informative and visually appealing plots and charts ( Image credit ) Seaborn Seaborn is a Python datavisualization library built on top of Matplotlib.
That’s why diversifying enterprise AI and ML usage can prove invaluable to maintaining a competitive edge. ML is a computer science, data science and artificial intelligence (AI) subset that enables systems to learn and improve from data without additional programming interventions. What is machine learning?
In the 1980s and 1990s, the field of natural language processing (NLP) began to emerge as a distinct area of research within AI. You should be comfortable working with data structures, algorithms, and libraries like NumPy, Pandas, and TensorFlow.
Matplotlib/Seaborn: For datavisualization. Loading the dataset allows you to begin exploring and manipulating the data. Step 3: ExploratoryDataAnalysis (EDA) ExploratoryDataAnalysis (EDA) is a critical step that involves examining the dataset to understand its structure, patterns, and anomalies.
1, Data is the new oil, but labeled data might be closer to it Even though we have been in the 3rd AI boom and machine learning is showing concrete effectiveness at a commercial level, after the first two AI booms we are facing a problem: lack of labeled data or data themselves. “Shut up and annotate!”
Blind 75 LeetCode Questions - LeetCode Discuss Data Manipulation and Analysis Proficiency in working with data is crucial. This includes skills in data cleaning, preprocessing, transformation, and exploratorydataanalysis (EDA).
This data challenge took NFL player performance data and fantasy points from the last 6 seasons to calculate forecasted points to be scored in the 2024 NFL season that began Sept. AI / ML offers tools to give a competitive edge in predictive analytics, business intelligence, and performance metrics.
It ensures that the data used in analysis or modeling is comprehensive and comprehensive. Integration also helps avoid duplication and redundancy of data, providing a comprehensive view of the information. EDA provides insights into the data distribution and informs the selection of appropriate preprocessing techniques.
Overview of Typical Tasks and Responsibilities in Data Science As a Data Scientist, your daily tasks and responsibilities will encompass many activities. You will collect and clean data from multiple sources, ensuring it is suitable for analysis. This step ensures that all relevant data is available in one place.
ExploratoryDataAnalysis(EDA)on Biological Data: A Hands-On Guide Unraveling the Structural Data of Proteins, Part II — ExploratoryDataAnalysis Photo from Pexels In a previous post, I covered the background of this protein structure resolution data set, including an explanation of key data terminology and details on how to acquire the data.
Data science equips you with the tools and techniques to manage big data, perform exploratorydataanalysis, and extract meaningful information from complex datasets. Making data-driven decisions: Data science empowers you to make informed decisions by analyzing and interpreting data.
A Introduction to HiPlot for DataAnalysis and Machine Learning Image by Author with @MidJourney Introduction Datavisualization is an essential tool for understanding complex datasets. Overall, this article aims to provide a comprehensive guide to using HiPlot for datavisualization and analysis.
Example Use Cases Altair is commonly used in ExploratoryDataAnalysis (EDA) to quickly visualise data distributions, relationships, and trends. Example Use Cases ggplot in Python is ideal for exploratoryDataAnalysis, particularly when users want to quickly understand patterns and relationships between variables.
Create a new data flow To create your data flow, complete the following steps: On the SageMaker console, choose Amazon SageMaker Studio in the navigation pane. On the Studio Home page, choose Import & prepare datavisually. Alternatively, on the File drop-down, choose New , then choose SageMaker Data Wrangler Flow.
Proficient in programming languages like Python or R, data manipulation libraries like Pandas, and machine learning frameworks like TensorFlow and Scikit-learn, data scientists uncover patterns and trends through statistical analysis and datavisualization. DataVisualization: Matplotlib, Seaborn, Tableau, etc.
It accomplishes this by finding new features, called principal components, that capture the most significant patterns in the data. These principal components are ordered by importance, with the first component explaining the most variance in the data. Visualize the data in the new feature space to gain insights.
Objectives The challenge embraced several dataanalysis dimensions: from data cleaning and exploratorydataanalysis (EDA) to insightful datavisualization and predictive modeling. About Ocean Protocol Ocean was founded to level the playing field for AI and data.
A Data Scientist requires to be able to visualize quickly the data before creating the model and Tableau is helpful for that. Tableau further has its own drawbacks in case of its use in Data Science considering it is a DataAnalysis tool rather than a tool for Data Science.
Learn how Data Scientists use ChatGPT, a potent OpenAI language model, to improve their operations. ChatGPT is essential in the domains of natural language processing, modeling, dataanalysis, data cleaning, and datavisualization. It facilitates exploratoryDataAnalysis and provides quick insights.
This comprehensive blog outlines vital aspects of Data Analyst interviews, offering insights into technical, behavioural, and industry-specific questions. It covers essential topics such as SQL queries, datavisualization, statistical analysis, machine learning concepts, and data manipulation techniques.
The Art of Forecasting in the Retail Industry Part I : ExploratoryDataAnalysis & Time Series Analysis In this article, I will conduct exploratorydataanalysis and time series analysis using a dataset consisting of product sales in different categories from a store in the US between 2015 and 2018.
Plotly allows developers to embed interactive features such as zooming, panning, and hover effects directly into the plots, making it ideal for ExploratoryDataAnalysis and dynamic reports.
We organize all of the trending information in your field so you don't have to. Join 17,000+ users and stay up to date on the latest articles your peers are reading.
You know about us, now we want to get to know you!
Let's personalize your content
Let's get even more personalized
We recognize your account from another site in our network, please click 'Send Email' below to continue with verifying your account and setting a password.


Let's personalize your content