This site uses cookies to improve your experience. To help us insure we adhere to various privacy regulations, please select your country/region of residence. If you do not select a country, we will assume you are from the United States. Select your Cookie Settings or view our Privacy Policy and Terms of Use.
Cookie Settings
Cookies and similar technologies are used on this website for proper function of the website, for tracking performance analytics and for marketing purposes. We and some of our third-party providers may use cookie data for various purposes. Please review the cookie settings below and choose your preference.
Used for the proper function of the website
Used for monitoring website traffic and interactions
Cookie Settings
Cookies and similar technologies are used on this website for proper function of the website, for tracking performance analytics and for marketing purposes. We and some of our third-party providers may use cookie data for various purposes. Please review the cookie settings below and choose your preference.
Strictly Necessary: Used for the proper function of the website
Performance/Analytics: Used for monitoring website traffic and interactions
Summary: Big Datavisualization involves representing large datasets graphically to reveal patterns, trends, and insights that are not easily discernible from raw data. quintillion bytes of data daily, the need for effective visualization techniques has never been greater. As we generate approximately 2.5
By Nate Rosidi , KDnuggets Market Trends & SQL Content Specialist on June 11, 2025 in Language Models Image by Author | Canva If you work in a data-related field, you should update yourself regularly. Data scientists use different tools for tasks like datavisualization, datamodeling, and even warehouse systems.
Research Data Scientist Description : Research Data Scientists are responsible for creating and testing experimental models and algorithms. According to Google AI, they work on projects that may not have immediate commercial applications but push the boundaries of AI research.
A Data Product can take various forms, depending on the domain’s requirements and the data it manages. It could be a curated dataset, a machine learning model, an API that exposes data, a real-time data stream, a datavisualization dashboard, or any other data-related asset that provides value to the organization.
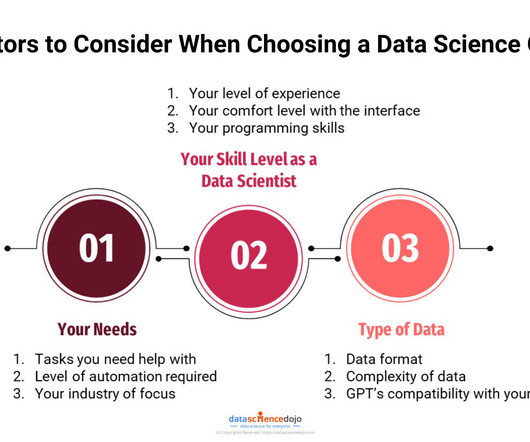
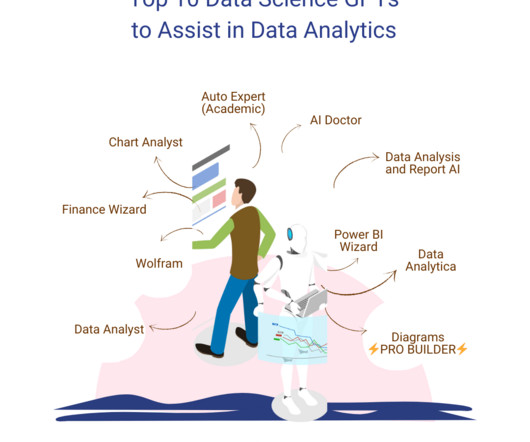
GPTs for Data science are the next step towards innovation in various data-related tasks. These are platforms that integrate the field of data analytics with artificial intelligence (AI) and machine learning (ML) solutions. What are GPTs for data science? This custom GPT is created by Open AI’s ChatGPT.
These skills include programming languages such as Python and R, statistics and probability, machine learning, datavisualization, and datamodeling. Data preparation is an essential step in the data science workflow, and data scientists should be familiar with various data preparation tools and best practices.
In the digital era, datavisualization stands as an indispensable tool in the realm of business intelligence. It represents the graphical display of data and information, transforming complex datasets into intuitive and understandable visuals.
Data science GPTs are the next step towards innovation in various data-related tasks. OpenAI’s GPT store is designed to make AI-powered solutions more accessible to different community members. However, our focus lies on exploring the data science GPTs available on the platform. What are data science GPTs?
GPTs for Data science are the next step towards innovation in various data-related tasks. These are platforms that integrate the field of data analytics with artificial intelligence (AI) and machine learning (ML) solutions. What are GPTs for data science? This custom GPT is created by Open AI’s ChatGPT.
Key features of cloud analytics solutions include: Datamodels , Processing applications, and Analytics models. Datamodels help visualize and organize data, processing applications handle large datasets efficiently, and analytics models aid in understanding complex data sets, laying the foundation for business intelligence.
Data scientists will be replaced by artificial intelligence As artificial intelligence advances, a common misconception arises that AI will replace all human intelligent labor. Today’s AI systems, even the most advanced ones, require human guidance to work.
Introduction In 2025, the role of a data scientist remains one of the most sought-after and lucrative career paths in India’s rapidly growing technology and business sectors. Validation techniques ensure models perform well on unseen data.
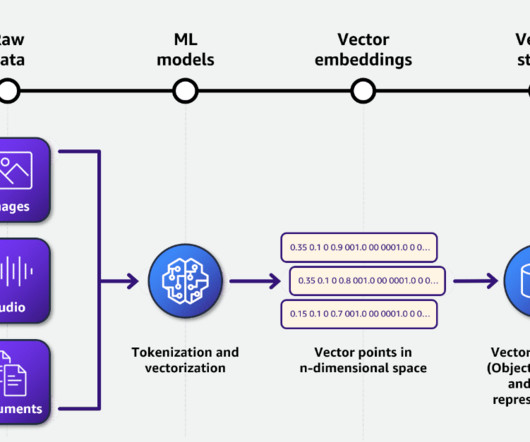
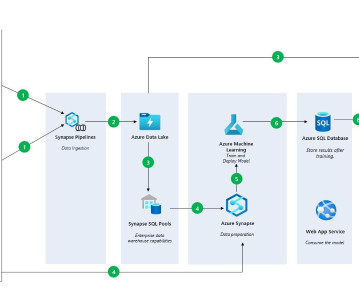
Today, generative AI can help bridge this knowledge gap for nontechnical users to generate SQL queries by using a text-to-SQL application. Solution overview This solution is primarily based on the following services: Foundational model We use Anthropics Claude 3.5 The following diagram provides more details about embeddings.
Companies working on AI technology can use it to improve scalability and optimize the decision-making process. This feature helps automate many parts of the data preparation and datamodel development process. This significantly reduces the amount of time needed to engage in data science tasks. Neptune.ai.
Using Azure ML to Train a Serengeti DataModel, Fast Option Pricing with DL, and How To Connect a GPU to a Container Using Azure ML to Train a Serengeti DataModel for Animal Identification In this article, we will cover how you can train a model using Notebooks in Azure Machine Learning Studio. Report: U.S.
Overview: Data science vs data analytics Think of data science as the overarching umbrella that covers a wide range of tasks performed to find patterns in large datasets, structure data for use, train machine learning models and develop artificial intelligence (AI) applications.
This new approach has proven to be much more effective, so it is a skill set that people must master to become data scientists. For example, many cryptocurrency platforms like Safetrading use AI to review services that provide free trading signals , which makes accuracy and speed higher. Definition: Data Mining vs Data Science.
To be effective, those visualizations must form part of a wider anti-fraud management cycle of detection, investigation and prevention stages. Experienced analysts and investigators have an important part to play at every stage, as do advanced technologies like AI and machine learning. Let’s explore that scenario in detail.
It is the process of converting raw data into relevant and practical knowledge to help evaluate the performance of businesses, discover trends, and make well-informed choices. Data gathering, data integration, datamodelling, analysis of information, and datavisualization are all part of intelligence for businesses.
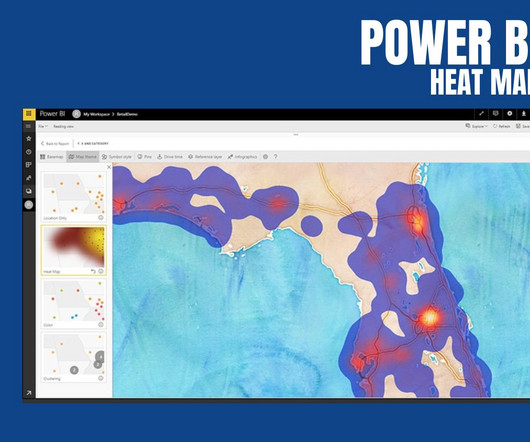
Power BI proves to be the best tool for analysis and visualization of data. Microsoft Power BI is a Business Intelligence and DataVisualization tool which assists organizations to analyze data from multiple sources, convert it into an interactive dashboard and share insights.
Some of the applications of data science are driverless cars, gaming AI, movie recommendations, and shopping recommendations. Since the field covers such a vast array of services, data scientists can find a ton of great opportunities in their field. Data scientists use algorithms for creating datamodels.
It integrates seamlessly with a wide range of data sources like Excel, Azure and SQL server, Salesforce, SAP Hana, IBM Netezza and CDP which makes it a compelling choice for businesses that have already invested in the Microsoft ecosystem. It allows users to create highly customizable and visually appealing reports.
The role of Python is not just limited to Data Science. It’s a universal programming language that finds application in different technologies like AI, ML, Big Data and others. DataModeling : Using libraries like scikit-learn and Tensorflow, one can build and evaluate predictive models.
Generative AI has rapidly transformed industries by enabling advanced automation, personalized experiences and groundbreaking innovations. This guide outlines six best practices to ensure your generative AI initiatives are effective: valuable, scalable, compliant and future-proof. Check out this demo of fine-tuning a gen AI chatbot.
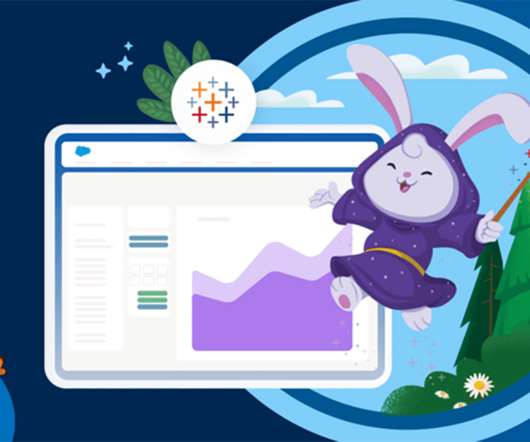
Natively connect to trusted, unified customer data. Take action with AI-powered insights in the flow of work. Cut costs by consolidating data warehouse investments. Think of Tableau as your datavisualization and business intelligence layer on top of Genie—allowing you to see, understand, and act on your live customer data.
Natively connect to trusted, unified customer data. Take action with AI-powered insights in the flow of work. Cut costs by consolidating data warehouse investments. Think of Tableau as your datavisualization and business intelligence layer on top of Genie—allowing you to see, understand, and act on your live customer data.
Summary: Business Intelligence Analysts transform raw data into actionable insights. They use tools and techniques to analyse data, create reports, and support strategic decisions. Key skills include SQL, datavisualization, and business acumen. Introduction We are living in an era defined by data.
Additionally, Machine Learning Engineers are proficient in implementing AI or ML algorithms. What do machine learning engineers do: They implement and train machine learning modelsDatamodeling One of the primary tasks in machine learning is to analyze unstructured datamodels, which requires a solid foundation in datamodeling.
Summary: This blog dives into the most promising Power BI projects, exploring advanced datavisualization, AI integration, IoT & blockchain analytics, and emerging technologies. Discover best practices for successful implementation and propel your organization towards data-driven success.
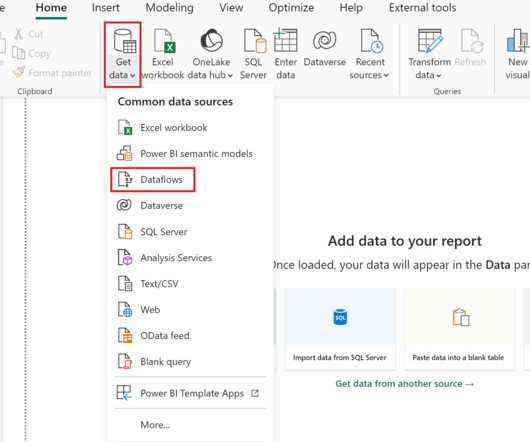
However, we have not yet touched on dataflows and the importance of this unique type of data product. In this blog, we will explain dataflows and their use cases and show an example of how to bring data from Snowflake AIData Cloud into a dataflow. What are Dataflows, and Why are They So Great?
It uses advanced tools to look at raw data, gather a data set, process it, and develop insights to create meaning. Areas making up the data science field include mining, statistics, data analytics, datamodeling, machine learning modeling and programming. This led to the theory and development of AI.
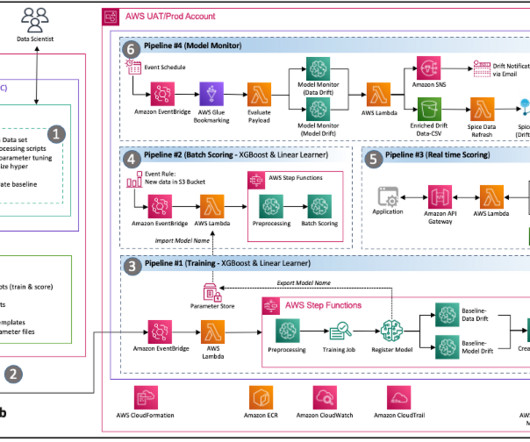
This post was written in collaboration with Bhajandeep Singh and Ajay Vishwakarma from Wipro’s AWS AI/ML Practice. Many organizations have been using a combination of on-premises and open source data science solutions to create and manage machine learning (ML) models.
Explainable AI refers to ways of ensuring that the results and outputs of artificial intelligence (AI) can be understood by humans. It contrasts with the concept of the “black box” AI, which produces answers with no explanation or understanding of how it arrived at them.
Business Intelligence tools encompass a variety of software applications designed to collect, process, analyse, and present business data. These tools enable organizations to convert raw data into actionable insights through various means such as reporting, analytics, datavisualization, and performance management.
Proficient in programming languages like Python or R, data manipulation libraries like Pandas, and machine learning frameworks like TensorFlow and Scikit-learn, data scientists uncover patterns and trends through statistical analysis and datavisualization. DataVisualization: Matplotlib, Seaborn, Tableau, etc.
Apache Airflow Apache Airflow is a workflow automation tool that allows data engineers to schedule, monitor, and manage data pipelines efficiently. It helps streamline data processing tasks and ensures reliable execution. It helps organisations understand their data better and make informed decisions.
Though just about every industry imaginable utilizes the skills of a data-focused professional, each has its own challenges, needs, and desired outcomes. This is why you’ll often find that there are jobs in AI specific to an industry, or desired outcome when it comes to data. Well then, you’re in luck. Check it out here !
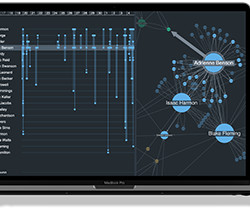
Two streams ran at speed in parallel—stakeholder interviews leading to a UI wire-frame design, and development of the UI in React alongside design and population of the datamodel. What possibilities did this datavisualization project highlight?
Summary: Tableau is fantastic for datavisualization, but understanding your data is key. Data types in Tableau act like labels, telling Tableau if it’s a number for calculations, text for labels, or a date for trends. Using the right type ensures accuracy and avoids misleading visuals.
In 2020, we released some of the most highly-anticipated features in Tableau, including dynamic parameters , new datamodeling capabilities , multiple map layers and improved spatial support, predictive modeling functions , and Metrics. We continue to make Tableau more powerful, yet easier to use.
They are useful for big data analytics where flexibility is needed. DataModelingDatamodeling involves creating logical structures that define how data elements relate to each other. This includes: Dimensional Modeling : Organizes data into dimensions (e.g., time, product) and facts (e.g.,
Think of Tableau as your datavisualization and business intelligence layer on top of Data Cloud—allowing you to see, understand, and act on your live customer data. Or, because it’s optimized for customer data, let’s call it a customer graph.) Let’s get into the nuts and bolts.
But its status as the go-between for programming and data professionals isn’t its only power. Within SQL you can also filter data, aggregate it and create valuations, manipulate data, update it, and even do datamodeling.
Key Features of Power BI: Power BI is a powerful business intelligence tool developed by Microsoft that enables users to visualize and analyze data from various sources. It offers a wide range of features that make it a popular choice for data professionals, analysts, and organizations. appeared first on Pickl AI.
We organize all of the trending information in your field so you don't have to. Join 17,000+ users and stay up to date on the latest articles your peers are reading.
You know about us, now we want to get to know you!
Let's personalize your content
Let's get even more personalized
We recognize your account from another site in our network, please click 'Send Email' below to continue with verifying your account and setting a password.


Let's personalize your content