This site uses cookies to improve your experience. To help us insure we adhere to various privacy regulations, please select your country/region of residence. If you do not select a country, we will assume you are from the United States. Select your Cookie Settings or view our Privacy Policy and Terms of Use.
Cookie Settings
Cookies and similar technologies are used on this website for proper function of the website, for tracking performance analytics and for marketing purposes. We and some of our third-party providers may use cookie data for various purposes. Please review the cookie settings below and choose your preference.
Used for the proper function of the website
Used for monitoring website traffic and interactions
Cookie Settings
Cookies and similar technologies are used on this website for proper function of the website, for tracking performance analytics and for marketing purposes. We and some of our third-party providers may use cookie data for various purposes. Please review the cookie settings below and choose your preference.
Strictly Necessary: Used for the proper function of the website
Performance/Analytics: Used for monitoring website traffic and interactions
Events Data + AI Summit Data + AI World Tour Data Intelligence Days Event Calendar Blog and Podcasts Databricks Blog Explore news, product announcements, and more Databricks Mosaic Research Blog Discover the latest in our Gen AI research Data Brew Podcast Let’s talk data! Join now Ready to get started?
More and more often, businesses are using data to drive their decisions — which makes cutting-edge analytics and businessintelligence strategies one of the best advantages a company can have. Here are the six trends you should be aware of that will reshape businessintelligence in 2020 and throughout the new decade.
This week, Gartner published the 2021 Magic Quadrant for Analytics and BusinessIntelligence Platforms. Gartner has again recognized Tableau as a Leader—for our ninth consecutive year. . I first want to thank you, the Tableau Community, for your continued support and your commitment to data, to Tableau, and to each other.
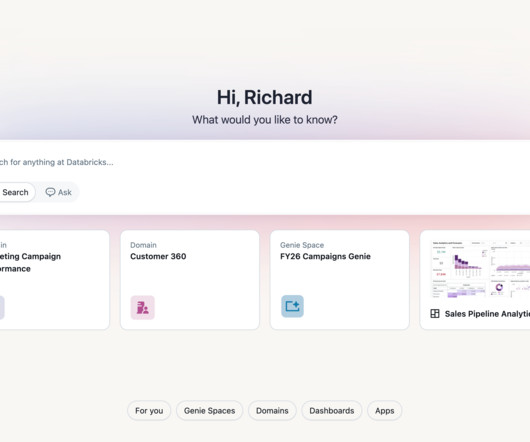
Spencer Czapiewski September 12, 2024 - 8:38pm Karen Madera Senior Manager, Product Marketing, Tableau We’re in the midst of an autonomous revolution that’s reshaping the way businesses use data to gain a competitive edge, delight customers, and engage employees. Some just want answers delivered to them in the context of their work.
Chief Product Officer, Tableau. Tableau has been named a Leader in the Gartner Magic Quadrant for Analytics & BusinessIntelligence Platforms for the 10th consecutive year. We believe a decade as a Leader is an incredible milestone—and it wouldn’t be possible without you, our amazing Tableau Community. .
Chief Product Officer, Tableau. Tableau has been named a Leader in the Gartner Magic Quadrant for Analytics & BusinessIntelligence Platforms for the 10th consecutive year. We believe a decade as a Leader is an incredible milestone—and it wouldn’t be possible without you, our amazing Tableau Community. .
As the use of intelligence technologies is staggering, knowing the latest trends in businessintelligence is a must. The market for businessintelligence services is expected to reach $33.5 top 5 key platforms that control the future of businessintelligence impacts BI may have on your business in the future.
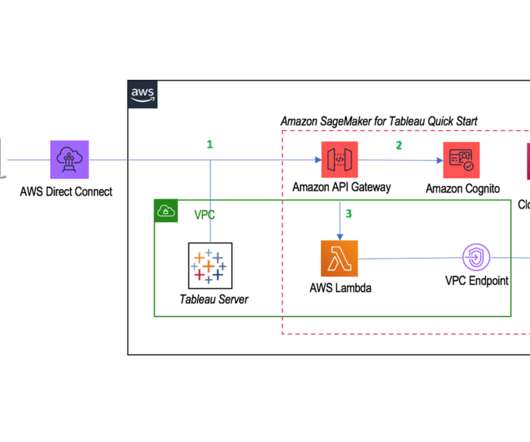
Product Manager, Tableau . Dylan Tong, Global Segment Lead Architect, AI Augmented Analytics, AWS. The ability to forecast demand and predict behavior can drive business growth, reduce churn and attrition, and optimize processes and supply chains. . Amazon SageMaker for Tableau architecture. Kristin Adderson.
Guest author, Tableau DataDev Ambassador. Tableau is an innovator in the field of data visualization with its ease of use, stunning visualizations, vibrant community, and more contributing to success. Tableau recognizes that the way we use data today and the field of analytics is much different now than even a decade ago.
Companies use BusinessIntelligence (BI), Data Science , and Process Mining to leverage data for better decision-making, improve operational efficiency, and gain a competitive edge. Data Mesh on Azure Cloud with Databricks and Delta Lake for Applications of BusinessIntelligence, Data Science and Process Mining.
Guest author, Tableau DataDev Ambassador. Tableau is an innovator in the field of data visualization with its ease of use, stunning visualizations, vibrant community, and more contributing to success. Tableau recognizes that the way we use data today and the field of analytics is much different now than even a decade ago.
End-users of data catalogs Typical users include data scientists, analysts, data engineers, and business users. Additionally, roles within businessintelligence (BI) and data governance teams frequently rely on data catalogs to perform their tasks. AI and machine learning: Automation of metadata processes to enhance efficiency.
Generative AI (GenAI) is stepping in to change the game by making data analytics accessible to everyone. As data keeps growing, tools powered by Generative AI for data analytics are helping businesses and individuals tap into this potential, making decisions faster and smarter.
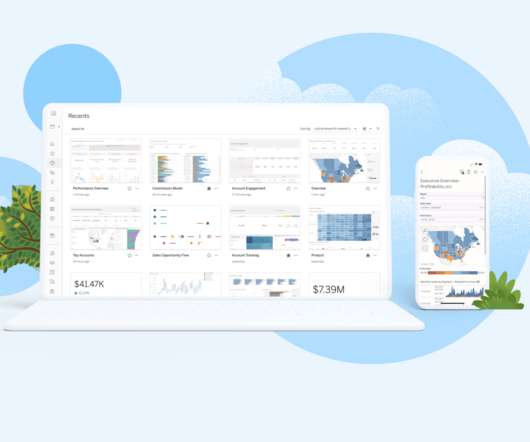
Senior Vice President, Product Marketing, Tableau. Every company today is being asked to do more with less, and leaders need access to fresh, trusted KPIs and data-driven insights to manage their businesses, keep ahead of the competition, and provide unparalleled customer experiences. . Allison (Ally) Witherspoon Johnston. Up to date.
Senior Vice President, Product Marketing, Tableau. Every company today is being asked to do more with less, and leaders need access to fresh, trusted KPIs and data-driven insights to manage their businesses, keep ahead of the competition, and provide unparalleled customer experiences. . Allison (Ally) Witherspoon Johnston. Up to date.
Summary: Data Visualisation is crucial to ensure effective representation of insights tableau vs power bi are two popular tools for this. This article compares Tableau and Power BI, examining their features, pricing, and suitability for different organisations. What is Tableau? billion in 2023. from 2022 to 2028.
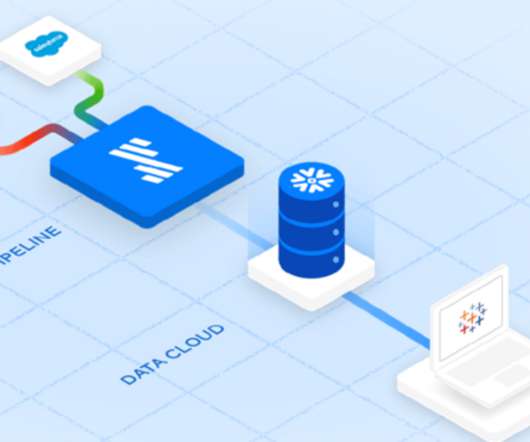
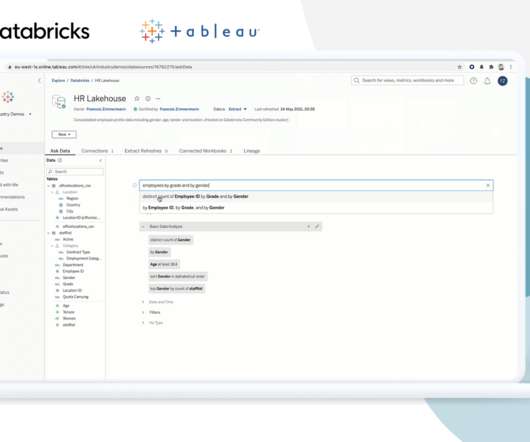
EMEA Field CTO, Tableau. In many of the conversations we have with IT and business leaders, there is a sense of frustration about the speed of time-to-value for big data and data science projects. The lakehouse model provides distinct advantages for Tableau customers. Francois Zimmermann. Brian Dirking. Kristin Adderson.
This week, Gartner published the 2021 Magic Quadrant for Analytics and BusinessIntelligence Platforms. Gartner has again recognized Tableau as a Leader—for our ninth consecutive year. . I first want to thank you, the Tableau Community, for your continued support and your commitment to data, to Tableau, and to each other.
Summary: BusinessIntelligence tools are software applications that help organizations collect, process, analyse, and visualize data from various sources. These tools transform raw data into actionable insights, enabling businesses to make informed decisions, improve operational efficiency, and adapt to market trends effectively.
In today’s fast-paced business landscape, companies need to stay ahead of the curve to remain competitive. Businessintelligence (BI) has emerged as a key solution to help companies gain insights into their operations and market trends. What is businessintelligence?
In today’s fast-paced business landscape, companies need to stay ahead of the curve to remain competitive. Businessintelligence (BI) has emerged as a key solution to help companies gain insights into their operations and market trends. What is businessintelligence?
Summary: BusinessIntelligence Analysts transform raw data into actionable insights. Key skills include SQL, data visualization, and business acumen. From customer interactions to market trends, every aspect of business generates a wealth of information. What Is BusinessIntelligence?
In addition to BusinessIntelligence (BI), Process Mining is no longer a new phenomenon, but almost all larger companies are conducting this data-driven process analysis in their organization. This aspect can be applied well to Process Mining, hand in hand with BI and AI. Click to enlarge!
Summary: Understanding BusinessIntelligence Architecture is essential for organizations seeking to harness data effectively. By implementing a robust BI architecture, businesses can make informed decisions, optimize operations, and gain a competitive edge in their industries. What is BusinessIntelligence Architecture?
Senior Director, Product Management, Tableau. Tableau partner Snowflake surveyed business and technology leaders to learn what it means to win in the data economy , what characterizes leaders and laggards, and how it’s important to care about data to achieve successful outcomes. Nicolas Brisoux. Kristin Adderson. August 1, 2022.
AI is making it easier than ever to succeed in this growing field. The application of Artificial intelligence and BusinessIntelligence in affiliate marketing has been actively discussed for quite a time. Bloggers are using AI to better identify target customers and create the right content for them.
Senior Director, Product Management, Tableau. Tableau partner Snowflake surveyed business and technology leaders to learn what it means to win in the data economy , what characterizes leaders and laggards, and how it’s important to care about data to achieve successful outcomes. Nicolas Brisoux. Kristin Adderson. August 1, 2022.
We’re looking at advanced artificial intelligence (AI) models, predictive analytics, and machine learning algorithms that can dive even deeper into data, delivering unprecedented insights. Tableau : It’s a visual analytics platform that transforms raw data into interactive, real-time dashboards.
Product Manager, Tableau . Dylan Tong, Global Segment Lead Architect, AI Augmented Analytics, AWS. The ability to forecast demand and predict behavior can drive business growth, reduce churn and attrition, and optimize processes and supply chains. . Amazon SageMaker for Tableau architecture. Kristin Adderson.
Tableau is a data visualisation software helping you to generate graphics-rich reporting and analysing enormous volumes of data. With the help of Tableau, organisations have been able to mine and gather actionable insights from granular sources of data. But What is Tableau for Data Science and what are its advantages and disadvantages?
Allison (Ally) Witherspoon Johnston Senior Vice President, Product Marketing, Tableau Bronwen Boyd December 7, 2022 - 11:16pm February 14, 2023 In the quest to become a customer-focused company, the ability to quickly act on insights and deliver personalized customer experiences has never been more important. Up to date. Let’s explore how.
Summary: A donut chart in Tableau enhances data visualisation by providing a clear, clutter-free representation of proportions. This guide explains building and customising a donut chart, ensuring better readability and impactful storytelling in business dashboards. One such visualisation is the donut chart in Tableau.
RVP Analytics & AI, Insurance, Tableau. Without it, measuring and managing risk would be an impractical and ineffective business model. At Tableau, we call that Data Culture—and we believe it’s essential for unlocking the power of your data and your people. Meghan Cooney. Kristin Adderson. June 28, 2021 - 6:08pm.
Director of Global Industry Advisors, Retail and Consumer Goods Lead, Tableau. Fortunately, a modern data stack (MDS) using Fivetran, Snowflake, and Tableau makes it easier to pull data from new and various systems, combine it into a single source of truth, and derive fast, actionable insights. Jeff Huckaby. Kristin Adderson.
Senior Director, Product Management, Tableau. Tableau partner Snowflake surveyed business and technology leaders to learn what it means to win in the data economy , what characterizes leaders and laggards, and how it’s important to care about data to achieve successful outcomes. Nicolas Brisoux. Kristin Adderson. August 1, 2022.
TableauTableau is a leading data visualization tool known for its powerful capabilities and user-friendly interface. Use Cases Ideal for businesses needing to analyse large datasets and create detailed visualizations. With the right tools, organisations can transform raw data into meaningful insights that drive decision-making.
EMEA Field CTO, Tableau. In many of the conversations we have with IT and business leaders, there is a sense of frustration about the speed of time-to-value for big data and data science projects. The lakehouse model provides distinct advantages for Tableau customers. Francois Zimmermann. Brian Dirking. Kristin Adderson.
There are many well-known libraries and platforms for data analysis such as Pandas and Tableau, in addition to analytical databases like ClickHouse, MariaDB, Apache Druid, Apache Pinot, Google BigQuery, Amazon RedShift, etc. This tool automatically detects problems in an ML dataset.
Predictive modeling in business analytics Predictive modeling plays a critical role in business analytics by: Statistical scoring: Utilizing databases for real-time decision-making support. AI integration: Employing artificial intelligence for automation in response to unexpected events.
TableauTableau is a powerful businessintelligence tool that helps visualize data in an interactive manner through dashboards and reports. Use Cases: Walmart uses Tableau to analyse sales trends across its stores globally, helping optimise inventory management.
Introduction Data visualization is no longer just a niche skill; it’s a fundamental component of Data Analysis , businessintelligence, and data science. I’ve also started learning and working with Tableau Public [or Power BI Desktop , Python libraries like Matplotlib/Seaborn , etc.
Visualization libraries available in Python such as Matplotlib and Seaborn, and tools like Tableau and Power BI become crucial to telling stories that lead to insights. From analyzing business trends to building AI models, data science can contain a number of specializations, each with its skills and responsibilities to be mastered with it.
Introduction In the rapidly evolving landscape of data analytics, BusinessIntelligence (BI) tools have become indispensable for organizations seeking to leverage their big data stores for strategic decision-making. Tableau – Tableau is celebrated for its advanced data visualization and interactive dashboard features.
They use data visualisation tools like Tableau and Power BI to create compelling reports. Are you aiming for an entry-level role or looking to specialise in a particular area of Data Analytics, such as Machine Learning or BusinessIntelligence? The course includes hands-on Excel, R, SQL, and Tableau exposure.
We organize all of the trending information in your field so you don't have to. Join 17,000+ users and stay up to date on the latest articles your peers are reading.
You know about us, now we want to get to know you!
Let's personalize your content
Let's get even more personalized
We recognize your account from another site in our network, please click 'Send Email' below to continue with verifying your account and setting a password.


Let's personalize your content