This site uses cookies to improve your experience. To help us insure we adhere to various privacy regulations, please select your country/region of residence. If you do not select a country, we will assume you are from the United States. Select your Cookie Settings or view our Privacy Policy and Terms of Use.
Cookie Settings
Cookies and similar technologies are used on this website for proper function of the website, for tracking performance analytics and for marketing purposes. We and some of our third-party providers may use cookie data for various purposes. Please review the cookie settings below and choose your preference.
Used for the proper function of the website
Used for monitoring website traffic and interactions
Cookie Settings
Cookies and similar technologies are used on this website for proper function of the website, for tracking performance analytics and for marketing purposes. We and some of our third-party providers may use cookie data for various purposes. Please review the cookie settings below and choose your preference.
Strictly Necessary: Used for the proper function of the website
Performance/Analytics: Used for monitoring website traffic and interactions
Summary: BigData revolutionises promotional strategies by enabling personalised, data-driven marketing campaigns. Businesses leveraging BigData effectively gain a competitive edge in connecting with audiences and optimising campaign performance while fostering trust through responsible data use.
Summary: Data Visualisation is crucial to ensure effective representation of insights tableau vs power bi are two popular tools for this. This article compares Tableau and Power BI, examining their features, pricing, and suitability for different organisations. billion by 2032, with a CAGR of 9.0%. What is Tableau?
Introduction Data Science has become a driving force in decision-making across industries, from healthcare to finance. With the global Data Science platform market valued at $103.93 billion by 2032, growing at a CAGR of 24.7% , mastering Data Science skills is more critical than ever.
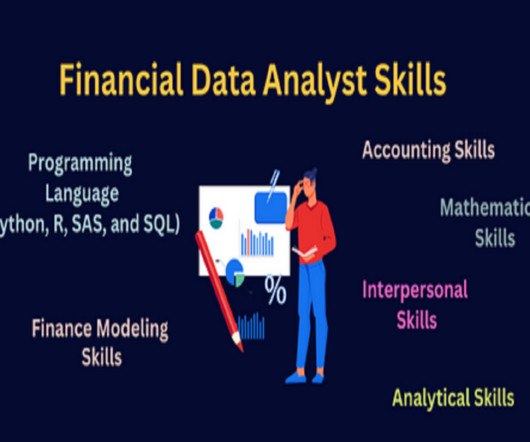
Did you know the overall employment of Financial Analysts is projected to grow 8 % from 2022 to 2032? Data visualization techniques such as charts, graphs, and dashboards enhance the understanding of financial data and facilitate decision-making processes. This is going to be faster than the average for all occupations.
We organize all of the trending information in your field so you don't have to. Join 17,000+ users and stay up to date on the latest articles your peers are reading.
You know about us, now we want to get to know you!
Let's personalize your content
Let's get even more personalized
We recognize your account from another site in our network, please click 'Send Email' below to continue with verifying your account and setting a password.


Let's personalize your content