This site uses cookies to improve your experience. To help us insure we adhere to various privacy regulations, please select your country/region of residence. If you do not select a country, we will assume you are from the United States. Select your Cookie Settings or view our Privacy Policy and Terms of Use.
Cookie Settings
Cookies and similar technologies are used on this website for proper function of the website, for tracking performance analytics and for marketing purposes. We and some of our third-party providers may use cookie data for various purposes. Please review the cookie settings below and choose your preference.
Used for the proper function of the website
Used for monitoring website traffic and interactions
Cookie Settings
Cookies and similar technologies are used on this website for proper function of the website, for tracking performance analytics and for marketing purposes. We and some of our third-party providers may use cookie data for various purposes. Please review the cookie settings below and choose your preference.
Strictly Necessary: Used for the proper function of the website
Performance/Analytics: Used for monitoring website traffic and interactions
By Vinod Chugani on June 27, 2025 in Data Science Image by Author | ChatGPT Introduction Creating interactive web-based data dashboards in Python is easier than ever when you combine the strengths of Streamlit , Pandas , and Plotly.
By Shamima Sultana on June 19, 2025 in Data Science Image by Editor | Midjourney While Python-based tools like Streamlit are popular for creating data dashboards, Excel remains one of the most accessible and powerful platforms for building interactive datavisualizations. Select Jan 2025 from Timeline.
Need both performance and flexibility in your data workflows? By Bala Priya C , KDnuggets Contributing Editor & Technical Content Specialist on June 19, 2025 in Programming Image by Author | Ideogram Youre architecting a new data pipeline or starting an analytics project, and you’re probably considering whether to use Python or Go.
By Nate Rosidi , KDnuggets Market Trends & SQL Content Specialist on June 11, 2025 in Language Models Image by Author | Canva If you work in a data-related field, you should update yourself regularly. Data scientists use different tools for tasks like datavisualization, data modeling, and even warehouse systems.
Welcome to the first issue of the Process for 2025. This is the newsletter for FlowingData members where we talk shop about visualizingdata in a way that doesn’t converge to mind-numbing defaults. I’m Nathan Yau. Should you credit the past work?
Several businesses are preparing for what is expected to be another record-breaking period of challenges in areas such as sales, customer engagement, and logistics as 2025 approaches. Why is speeding up RPA deployment the need in 2025? Why will it change in 2025? How can AI speed up RPA implementation in 2025?
Datavisualization has become a major part of life for those looking to make use of the large swathes of data available in the modern world. As important as this data is, understanding and making use of that data is even more important. That’s where datavisualization comes in. Images add to your SEO.
A look at how AI agents are reshaping the data analytics workflow and whether you’re ahead or behind the curve. xlsx"): df = pd.read_excel(uploaded_file) Next, the data exploration and datavisualization codes come in. And we did everything by using a real-life data project. value_counts().head(15)
Last Updated on April 14, 2025 by Editorial Team Author(s): John Loewen, PhD Originally published on Towards AI. No-fuss prompting for error-free Python Streamlit data viz code How easy is it to create datavisuals with GPT-4 and the Python Streamlit library? Way easier than I ever expected!
From October 28–30 in San Francisco, ODSC West 2025 returns with a robust lineup of 15 tracks aimed at helping professionals build practical skills and stay ahead of emerging trends in AI. Ideal for anyone focused on translating data into impactful visuals and stories. Expect deep-dive sessions and practical case studies.
Sign in Sign out Contributor Portal Latest Editor’s Picks Deep Dives Contribute Newsletter Toggle Mobile Navigation LinkedIn X Toggle Search Search Data Science How I Automated My Machine Learning Workflow with Just 10 Lines of Python Use LazyPredict and PyCaret to skip the grunt work and jump straight to performance.
Summary: In 2025, data scientists in India will be vital for data-driven decision-making across industries. It highlights the growing opportunities and challenges in India’s dynamic data science landscape. Each industry demands specialized data expertise to solve unique business challenges and drive innovation.
We’re excited to announce our official Call for Speakers for ODSC West 2025 ! If you are looking to share your research or expertise in data science and AI, this is for you. Data Science Data Engineering AgentOps, LLMOps, and MLOps — Popular ! We’ve got them!
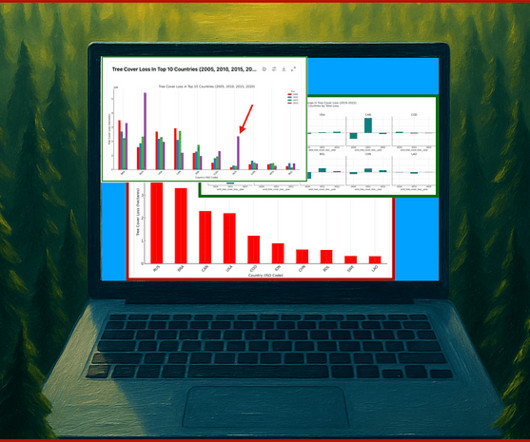
Last Updated on April 23, 2025 by Editorial Team Author(s): John Loewen, PhD Originally published on Towards AI. Exploratory analysis and data storytelling on global forest loss Prompting GPT-4 for exploratory data analysis and storytelling are an essential tool to add to your data science toolbox.
Nadieh Bremer, DataVisualization Designer at VisualCinnamon An award-winning designer and co-author of Data Sketches , Nadieh crafts one-of-a-kind datavisualizations from complex datasets with vibrant aesthetics. Register today and be part of the community thats transforming data science from the groundup.
In this guide, we’ll explore the steps to becoming a certified Excel professional in 2025. Microsoft Certified: Data Analyst Associate Target Audience : Professionals interested in Data Analysis. Skills Covered : Data preparation and visualization. Data Analysis and modelling. Exam Name : DA-100.
This blog delves into the transformative role of DataVisualization, decoding its various forms, from bar charts to radar charts. It emphasizes how effective visualization enhances comprehension, empowers decision-makers, and fosters a data-driven culture. Companies are generating huge volumes of data every day.
Last Updated on May 15, 2025 by Editorial Team Author(s): S Aishwarya Originally published on Towards AI. Strong data storytelling goes beyond simply visualizing numbers it uncovers the meaning behind the patterns, bringing clarity to what would otherwise be just a spreadsheet of values. 🔍What is Altair?
The AI Expo & Demo Hall at ODSC East 2025 this May 13th to 14th is set to be a game-changer, featuring some of the most influential companies in AI, data science, and machine learning. Postman For data scientists and developers working with APIs, Postman is a must-know tool. Get Your PassToday!
To my credit, I pushed out the picks for best datavisualization projects of the year , but I guess it’s time to push the attention inwards. Let’s see here… The first quarter of 2024 was focused on completing the second edition of Visualize This. On to 2025. At best, you get a couple days.
R: A powerful tool for statistical analysis and datavisualization, R is particularly useful for exploratory data analysis and research-focused AI applications. Its extensive libraries, such as TensorFlow, PyTorch, and Scikit-learn, streamline the development of machine learning and deep learning models.
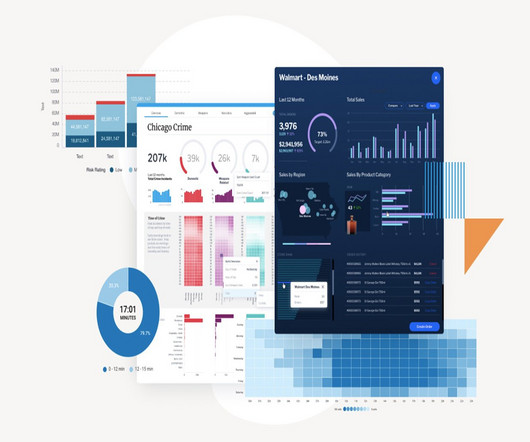
How do you measure the value of adding datavisualization to your web app? If you choose to build a visualization component using a datavisualization library, what is that investment worth? You’ll be able to justify whether or not datavisualization is a sound investment that’ll reap rewards.
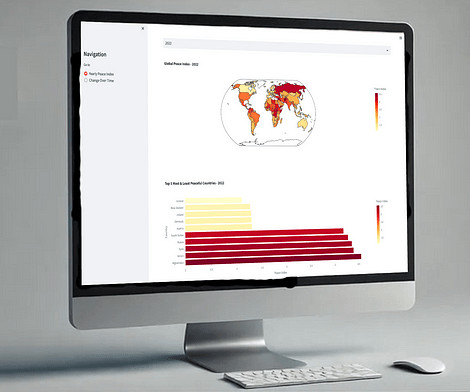
Last Updated on February 10, 2025 by Editorial Team Author(s): John Loewen, PhD Originally published on Towards AI. Showcasing data storytelling on the global peace index dataset This member-only story is on us. Upgrade to access all of Medium. Recently, I have been constantly hassling GPT-4 to generate Python Streamlit dashboard code.
Last Updated on May 7, 2025 by Editorial Team Author(s): Noro Chalise Originally published on Towards AI. Future Trends in Data Storytelling 15. What is Data Storytelling Data storytelling is the practice of using data, visuals, and clear language to tell a story that people can follow and understand.
So what can you expect from ODSC East 2025, May 1315 in Boston? New Pre-Bootcamp PrimerCourses Starting January 6th, our ODSC East AI Mini Bootcamp sessions dive into a core area of AI and data science, from AI/data literacy to advanced topics like large language models and AI Agents. Find outbelow!
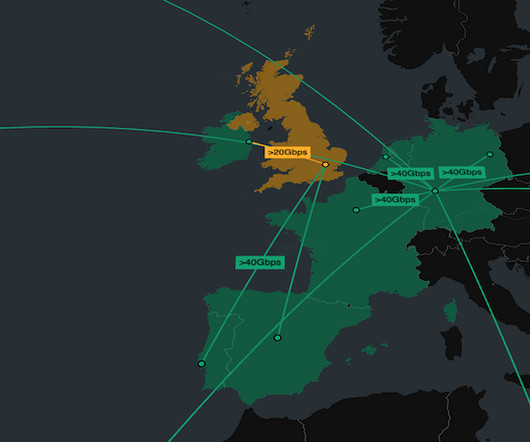
They integrate network and observations data with geospatial information to create seamless user experiences that reveal patterns across time and space. See MapWeave in action Join us on March 26, 2025 , to explore MapWeaves geospatial visualization, see live demos, and discover ways to get involved.
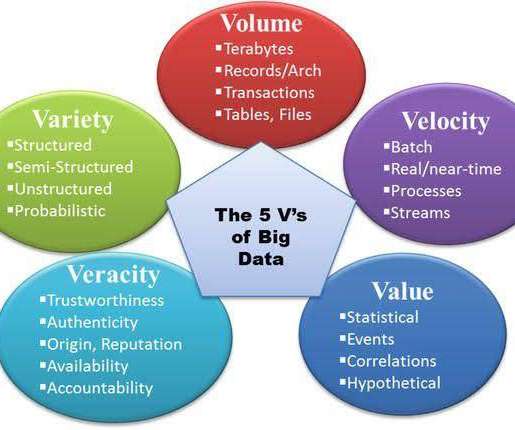
The big data market is projected to reach $325 billion by 2025. Leap forward since the adoption of big data analytics. Twinslash helps Edtech businesses build eLearning apps that leverage big data analytics. Statistics show that Edutech will have an average compound growth rate of 16.5% between 2022 and 2030.
trillion by the end of 2025. And they can generate more data. Building management systems (BMS) do not, however, leverage the data from their smart buildings. Facility managers can now use new technologies, such as datavisualization dashboards, to view the performance of their building. trillion across the world.
So what can you expect from ODSC East 2025, May 1315 in Boston? And we cant wait to give our ODSC East Boston community the opportunity to have a similar hackathon experience in 2025. New Venue For 2025 ODSC East is moving to the Boston Convention and Exhibition Center , in the up-and-coming Seaport neighborhood. Find outbelow!
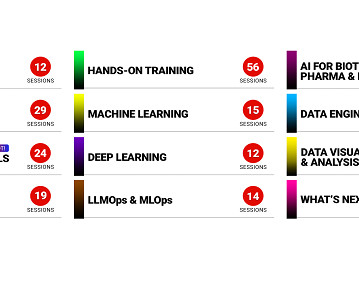
At ODSC East 2025 , were excited to present 12 curated tracks designed to equip data professionals, machine learning engineers, and AI practitioners with the tools they need to thrive in this dynamic landscape. DataVisualization TrackCommunicating Insights ThroughData Transform raw data into compelling visual narratives.
If you want to go beyond the trends and actually ignite your future career prospects, then you have to check out the AI mini-bootcamp as part of ODSC East 2025. Now let me break down how the ODSC East 2025 AI mini bootcamp is your unmissable opportunity if you really want to cut yourself a path inAI. You might ask yourself why?
Were thrilled to introduce you to the leading experts and passionate data and AI practitioners who will be guiding you through an exploration of the latest in AI and data science at ODSC East 2025 this May 13th to 15th. These luminaries come from the companies and institutions at the forefront of innovation. Government agencies.
Last Updated on April 25, 2025 by Editorial Team Author(s): Sefali Warner Originally published on Towards AI. The Analyze Data feature also allows users to input natural language queries, such as What are the sales trends in the last quarter? and Excel will instantly respond with relevant datavisualizations.
30% Off ODSC East, Fan-Favorite Speakers, Foundation Models for Times Series, and ETL Pipeline Orchestration The ODSC East 2025 Schedule isLIVE! Explore the must-attend sessions and cutting-edge tracks designed to equip AI practitioners, data scientists, and engineers with the latest advancements in AI and machine learning.
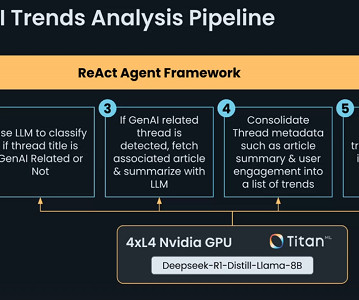
The data is gathered from Artificial Analysis , a website that provides independent analysis of AI models and providers, on April 4, 2025. Her past research interest covers a broad range of topics including model interpretability, graph neural network, human-in-the-loop AI and interactive datavisualization.
Build a Data Analyst AI Agent fromScratch Daniel Herrera, Principal Developer Advocate atTeradata Daniel Herrera guided attendees through the process of building a data analyst AI agent from the ground up. You can also register your interest for our next AI Builders Summit which is currently scheduled forJuly!
The role involves teaching and coordinating three entry and advanced-level courses each semester in areas such as machine learning, programming, computer vision, artificial intelligence, natural language processing, and datavisualization.
As youve likely seen by now, ODSC East 2025 this May 13th-15th will be very specialitll be the 10th anniversary! Now that ODSC has been a staple in the AI and data science community for ten years, wed like to share some numbers that highlight our growth over theyears. As of writing, weve published over 4000 blogs !
Editors note: David vonThenen is a speaker for ODSC East 2025 from May 13th to 15th. He brings deep expertise in building and training models for applications like NLP, datavisualization, and real-time analytics.
Business Intelligence and DataVisualization: Uses OpenSearch Dashboards to explore, analyze, and visualize structured and unstructured data in real time. Stay tuned for the next post! What's next? We recommend PyImageSearch University. Sharma, and P. Thakur, eds.,
Its aggressive sustainability goals included achieving net zero emissions by 2050, making all packaging reusable or recyclable by 2025 and investing more than USD 3 billion globally over several years to drive momentum.
The reporting deadline has been delayed from May 2025 to January 2026 for most companies, with an additional six months added in for small businesses. Decisions are expected in 2025, with potential enforcement by 2026 or 2027. This expansion requires businesses to be vigilant in tracking and reporting PFAS emissions.
Datavisualization tools like Tableau and Power BI can be applied to inform decisions. The market is anticipated to grow at a CAGR of 8.50% from 2025 to 2034. This expansion creates ample opportunities for Business Analysts, who stand at the forefront of data-driven decision-making. Who Is a Business Analyst?
We organize all of the trending information in your field so you don't have to. Join 17,000+ users and stay up to date on the latest articles your peers are reading.
You know about us, now we want to get to know you!
Let's personalize your content
Let's get even more personalized
We recognize your account from another site in our network, please click 'Send Email' below to continue with verifying your account and setting a password.


Let's personalize your content