This site uses cookies to improve your experience. To help us insure we adhere to various privacy regulations, please select your country/region of residence. If you do not select a country, we will assume you are from the United States. Select your Cookie Settings or view our Privacy Policy and Terms of Use.
Cookie Settings
Cookies and similar technologies are used on this website for proper function of the website, for tracking performance analytics and for marketing purposes. We and some of our third-party providers may use cookie data for various purposes. Please review the cookie settings below and choose your preference.
Used for the proper function of the website
Used for monitoring website traffic and interactions
Cookie Settings
Cookies and similar technologies are used on this website for proper function of the website, for tracking performance analytics and for marketing purposes. We and some of our third-party providers may use cookie data for various purposes. Please review the cookie settings below and choose your preference.
Strictly Necessary: Used for the proper function of the website
Performance/Analytics: Used for monitoring website traffic and interactions
Introduction In today’s data-driven landscape, mastering Tableau has become integral for professionals aiming to extract meaningful insights from diverse datasets. As we delve into Tableau interview questions and answers, […] The post Top 40 Tableau Interview Questions and Answers for 2024 appeared first on Analytics Vidhya.
Introduction While Tableau remains a popular choice for data visualization, its dominance is waning. The increasing importance of data analysis across industries has fueled the demand for versatile tools, leading to a surge in Tableau alternatives.
Spencer Czapiewski October 7, 2024 - 9:59pm Madeline Lee Product Manager, Technology Partners Enabling teams to make trusted, data-driven decisions has become increasingly complex due to the proliferation of data, technologies, and tools.
This feature was inspired by the New Chart Type Pilot on Tableau Public in spring 2023, where we saw excitement from our DataFam in how new visualizations were introduced. We wanted to empower the community to play an active role in the designing and developing their own viz types they use in Tableau. What are Viz Extensions?
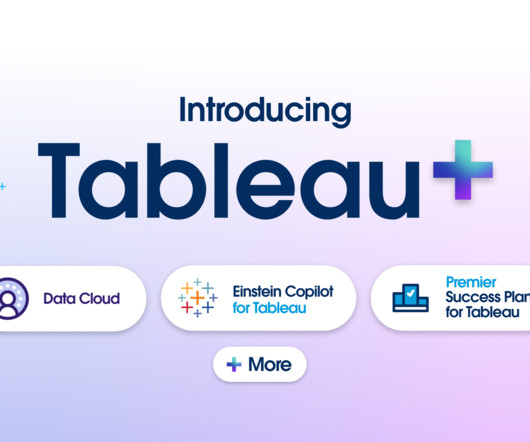
Kristin Adderson June 11, 2024 - 4:53pm Noel Carter Senior Product Marketing Manager, Tableau Evan Slotnick Product Management Director, Tableau At the Tableau Conference 2024 keynote , Tableau CEO Ryan Aytay spoke about the new wave of analytics: the consumerization of data. That’s why we created Tableau+.
Candice Vu February 19, 2024 - 11:17pm Matthew Miller Senior Director, Product Management With the evolution of voice-based assistants, chat bots, and generative AI assistants, it’s becoming ever more clear that interacting with technology via natural language prompts is here to stay. In 2020, Metrics in Tableau launched.
Spencer Czapiewski August 6, 2024 - 6:34pm Kyle Massey VP Lead Software Engineer Kyle Massey, a two-time Tableau DataDev Ambassador and co-leader of the DataPride Tableau User Group, shares his experience with VizQL Data Service. It’s one of the things that makes Tableau so easy to get started with.
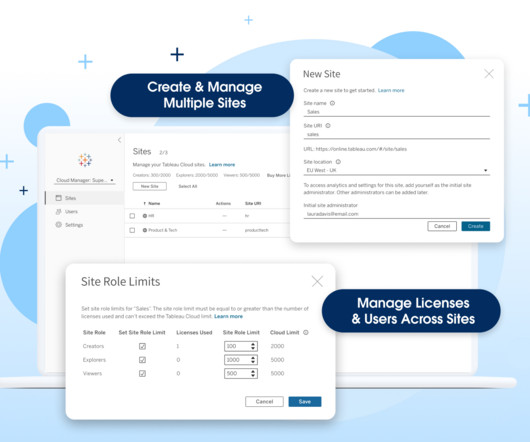
Spencer Czapiewski October 1, 2024 - 4:42pm Anika Martynowych Director, Product Management Earlier in my career, I was an admin for a massive e-commerce leader with an equally massive Tableau deployment. A migration to Tableau Cloud would have eased those challenges, but at the time, Tableau Cloud had a single site limit.
Spencer Czapiewski September 12, 2024 - 8:38pm Karen Madera Senior Manager, Product Marketing, Tableau We’re in the midst of an autonomous revolution that’s reshaping the way businesses use data to gain a competitive edge, delight customers, and engage employees. Some just want answers delivered to them in the context of their work.
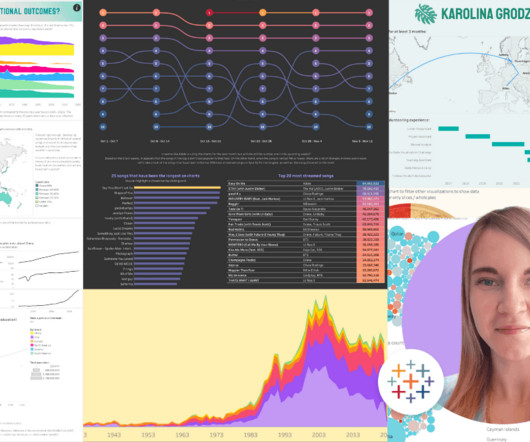
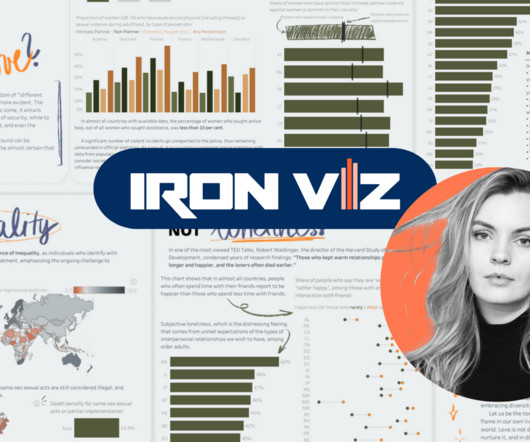
Ateken Abla March 19, 2024 - 9:05pm Larissa Amoroso Vice President, Tableau Community, Tableau When Karolina Grodzinska took the stage at Tableau Conference as part of her Iron Viz: Student Edition award, it felt like the culmination of her data learning, which started in 2021. How did Karolina discover Tableau? “It
Spencer Czapiewski September 11, 2024 - 7:45pm Madeline Lee Product Manager, Technology Partners Empowering teams to make data-driven decisions quickly and collaboratively is no longer optional—it's necessary for business success. While many of our customers use Tableau alongside Microsoft Teams, these workflows have been disconnected.
We had this in mind when in 2011, Tableau created the Ideas section of the Forums to help you share Tableau product features you’d like to see created. The Tableau Community inspires our work and helps us innovate further. What better way to effect change in this platform we love so much!
Spencer Czapiewski August 29, 2024 - 9:52pm Kirk Munroe Chief Analytics Officer & Founding Partner at Paint with Data Kirk Munroe, Chief Analytics Officer and Founding Partner at Paint with Data and Tableau DataDev Ambassador, explains the value of using relationships in your Tableau data models. over 4 years ago!),
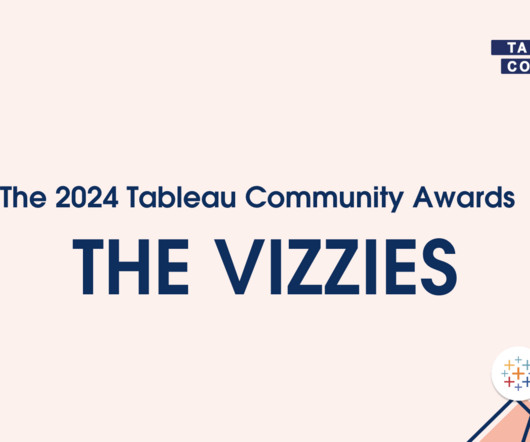
Sarah Molina May 1, 2024 - 3:25pm Emily Kund Data Visualization Specialist: Visual Analytics and Accessibility Consultant Matt Francis Wellcome Trust Sanger Institute For the community, by the community. This year, the annual awards took place during Tableau Conference 2024 in San Diego and recognized a total of 13 community members.
Chief Product Officer, Tableau. But Salesforce has a vision for creating a data-driven world, one where Tableau helps unlock all of your data and enable analytics everywhere, for everyone. Let’s take a look at all of the product innovations we shared in the Tableau keynote at Dreamforce. Francois Ajenstat. Candice Vu.
Chief Product Officer, Tableau. But Salesforce has a vision for creating a data-driven world, one where Tableau helps unlock all of your data and enable analytics everywhere, for everyone. Let’s take a look at all of the product innovations we shared in the Tableau keynote at Dreamforce. Francois Ajenstat. Candice Vu.
“Together, well supercharge Agentforce, Data Cloud, Tableau, MuleSoft, and Customer 360, enabling autonomous agents to act with intelligence, context, and confidence across every enterprise,” said Salesforce CEO Marc Benioff in the press release. billion in cash.
Sarah Molina April 3, 2024 - 10:38pm Danika Harrod Marketing Manager, Community Content & Events, Tableau Pata Gogová encountered Tableau for the first time four years ago. “I I landed on Tableau and stayed with it because I really got interested in the tool and began to explore more on my own.”
Danika Harrod December 20, 2024 - 10:44pm Dan Jewett Senior Vice President of Product Management As 2024 draws to a close, we want to express our heartfelt gratitude to the incredible Tableau Community. Thank you DataFam for inspiring, voting for, and sharing with us about the features released in 2024!
10 Must-Have AI Skills to Help You Excel Top 10 AI Engineering Skills to Have in 2024 1. Tools like Matplotlib, Seaborn, or Tableau help in creating understandable and visually appealing representations of complex data sets and results.
Danika Harrod October 22, 2024 - 5:46pm Larissa Amoroso Vice President, Tableau Community, TableauTableau Academic Ambassador Dr. Mary Dunaway has spent years empowering students and educators with skills such as data visualization. Curious to know more, she reached out to Tableau and met with a member of Tableau staff.
Ateken Abla July 9, 2024 - 7:30pm Danika Harrod Marketing Manager, Community Content & Events, Tableau How did Paul go from Tableau beginner to winning Iron Viz at his first attempt? Paul Ross is living proof that the Iron Viz title is possible for Tableau users of all skill-levels, from beginners to experts.
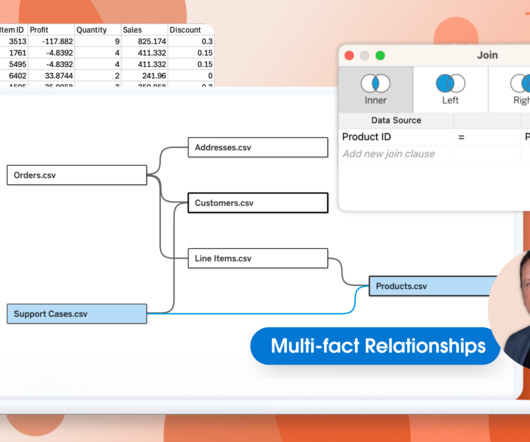
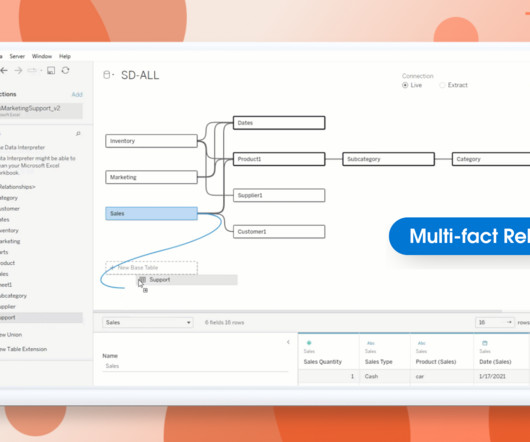
Spencer Czapiewski July 25, 2024 - 5:54pm Thomas Nhan Director, Product Management, Tableau Lari McEdward Technical Writer, Tableau Expand your data modeling and analysis with Multi-fact Relationships, available with Tableau 2024.2. What is Multi-fact Relationships in Tableau?
Kristin Adderson January 25, 2024 - 11:21pm Harveen Kathuria Senior Director, Product Management Tableau has been on the journey to help people see and understand their data for over two decades. That’s where Einstein Copilot for Tableau comes in. What is Einstein Copilot for Tableau?
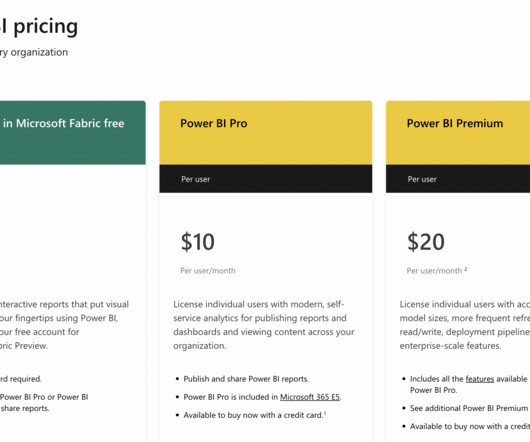
Summary: Data Visualisation is crucial to ensure effective representation of insights tableau vs power bi are two popular tools for this. This article compares Tableau and Power BI, examining their features, pricing, and suitability for different organisations. billion in 2024 and reach USD 63.76 What is Tableau?
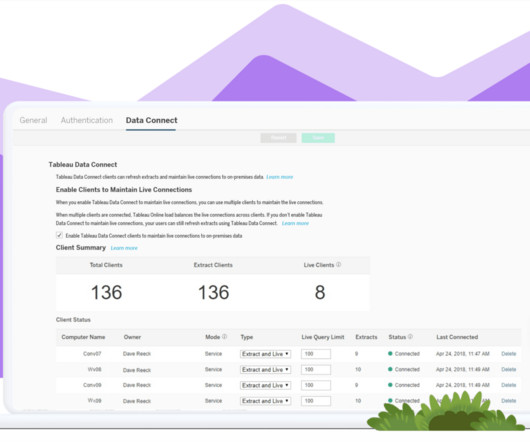
Candice Vu April 1, 2024 - 10:43pm Sanjeev Verma Product Management Senior Manager In today's data and AI-driven world, it’s important to have the right tools to navigate and analyze vast data sources. With Bridge, Tableau Cloud can securely access on-premises and virtual private cloud data through an established outbound connection.
Ateken Abla October 10, 2024 - 10:48pm Tristan Guillevin Tableau Visionary and Co-Founder LaDataViz Jessica Bautista DataDev Ambassador and Consultant LaDataViz Tableau Visionary Tristan Guillevin and DataDev Ambassador Jessica Bautista co-run LaDataViz, a data visualization studio and Tableau Developer Partner.
Spencer Czapiewski October 8, 2024 - 9:14pm Southard Jones Chief Product Officer, Tableau Since the announcement of Tableau Einstein, we've been thrilled by all the enthusiasm and curiosity from our community, customers, and partners. What is Tableau Einstein and why now?
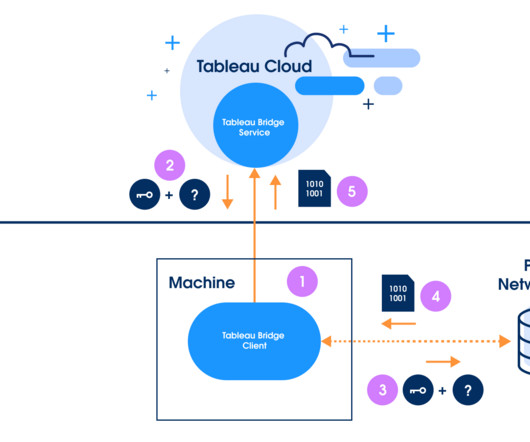
Candice Vu January 8, 2024 - 8:33pm In today's ever-evolving data landscape, the tools that aid in deciphering and navigating vast data sources and data sets are paramount. Tableau Bridge has emerged as a trusted ally for businesses harnessing the capabilities of Tableau Cloud. What is Tableau Bridge?
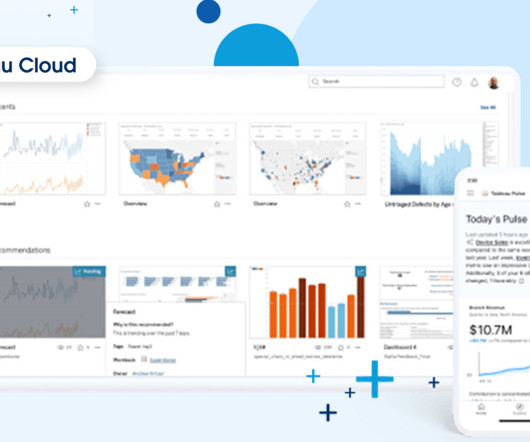
Bronwen Boyd May 3, 2022 - 7:32pm Noel Carter Senior Product Marketing Manager, TableauTableau Cloud is a fully-hosted, cloud-based, enterprise-grade analytics solution designed to empower organizations with intelligent tools and insights where people already work. New Tableau Pulse features come to Tableau Cloud every other week.
Spencer Czapiewski Southard Jones Chief Product Officer, Tableau Since the announcement of Tableau Next (formerly Tableau Einstein), we've been thrilled by all the enthusiasm and curiosity from our community, customers, and partners. What is Tableau Next and why now?
Summary: Tableau is fantastic for data visualization, but understanding your data is key. Data types in Tableau act like labels, telling Tableau if it’s a number for calculations, text for labels, or a date for trends. Tableau recognizes numbers, dates, text, locations, and more.
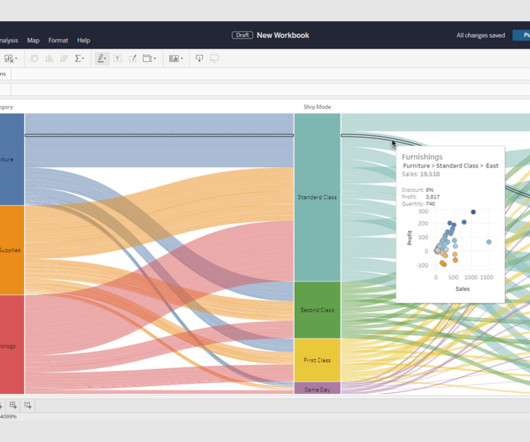
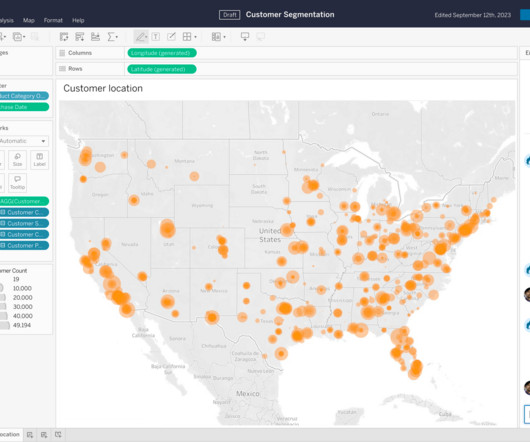
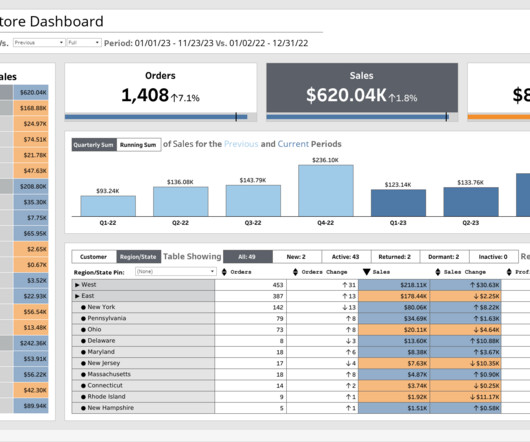
Interactive Superstore Tableau Dashboard Example Venkatesh lyer February 19, 2024 View Dashboard in Tableau This is an extremely interactive and feature-rich dashboard in which I have utilized all the techniques I shared as blogs in 2023, plus teasers for some upcoming blog topics.
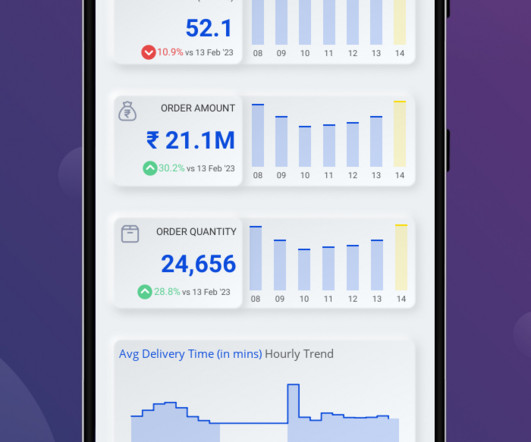
Delivery Analysis Tableau Dashboard | Mobile View Rishikesh Gundla March 12, 2024 View Dashboard in Tableau The Delivery Analysis Dashboard is a mobile-friendly dashboard with the same features and functionality as the desktop counterpart. The post Delivery Analysis Tableau Dashboard | Mobile View appeared first on phData.
The industry has evolved from relying on tools like SAS and R to placing a spotlight on data visualization tools like Tableau and PowerBI. Over the past 11 years in the field of data science, I’ve witnessed significant transformations.
Chief Product Officer, Tableau. But Salesforce has a vision for creating a data-driven world, one where Tableau helps unlock all of your data and enable analytics everywhere, for everyone. Let’s take a look at all of the product innovations we shared in the Tableau keynote at Dreamforce. Francois Ajenstat. Candice Vu.
Jessica Moon’s 2024 Iron Viz Qualifiers entry This is Jessica’s fifth time competing in Iron Viz. Iron Viz is a chance to prove to the world and myself what I'm capable of, and each time I learn something new about Tableau, data collection, and transformation.” By 2014, Jessica was a full-time Tableau viz tester.
Kathleen VanDerAa March 7, 2024 - 10:47pm Kate VanDerAa Every March, we celebrate women who have educated us, inspired us, led us, and significantly impacted the direction of society during Women's History Month. Don’t forget to star your favorites and follow these authors on Tableau Public. March 18, 2024
Whether driving engagement with fans, or helping athletes reach their potential, Team USA is all-in with analytics—building a digital HQ with Tableau and Salesforce Customer 360. The International Competitive Analysis team was the first group to reap the benefits, using Tableau to analyze and visualize complex competition results data.
Ateken Abla April 3, 2024 - 10:38pm Danika Harrod Marketing Manager, Community Content & Events, Tableau Chris Westlake fell in love with Tableau from the get-go. “I An internship using SQL for data extraction put Chris in touch with a team well versed in Tableau. “I I love Tableau User Groups!
Whether driving engagement with fans, or helping athletes reach their potential, Team USA is all-in with analytics—building a digital HQ with Tableau and Salesforce Customer 360. The International Competitive Analysis team was the first group to reap the benefits, using Tableau to analyze and visualize complex competition results data.
VP, Product Management, Tableau. At Tableau, we believe data is most valuable when everyone in an organization can use it to make better, data-driven decisions. The Tableau platform today deploys capabilities that favor certified trusted sources and measures, including: . Volker Metten. Bronwen Boyd. May 11, 2022 - 6:16pm.
VP, Product Management, Tableau. At Tableau, we believe data is most valuable when everyone in an organization can use it to make better, data-driven decisions. The Tableau platform today deploys capabilities that favor certified trusted sources and measures, including: . Volker Metten. Bronwen Boyd. May 11, 2022 - 6:16pm.
By analyzing conference session titles and abstracts from 2018 to 2024, we can trace the rise and fall of key trends that shaped the industry. The Rise and Plateau of Data Visualization 20182020: Data visualization was a major focus, with tools like Tableau, Power BI, and interactive dashboards gaining traction.
We organize all of the trending information in your field so you don't have to. Join 17,000+ users and stay up to date on the latest articles your peers are reading.
You know about us, now we want to get to know you!
Let's personalize your content
Let's get even more personalized
We recognize your account from another site in our network, please click 'Send Email' below to continue with verifying your account and setting a password.


Let's personalize your content