This site uses cookies to improve your experience. To help us insure we adhere to various privacy regulations, please select your country/region of residence. If you do not select a country, we will assume you are from the United States. Select your Cookie Settings or view our Privacy Policy and Terms of Use.
Cookie Settings
Cookies and similar technologies are used on this website for proper function of the website, for tracking performance analytics and for marketing purposes. We and some of our third-party providers may use cookie data for various purposes. Please review the cookie settings below and choose your preference.
Used for the proper function of the website
Used for monitoring website traffic and interactions
Cookie Settings
Cookies and similar technologies are used on this website for proper function of the website, for tracking performance analytics and for marketing purposes. We and some of our third-party providers may use cookie data for various purposes. Please review the cookie settings below and choose your preference.
Strictly Necessary: Used for the proper function of the website
Performance/Analytics: Used for monitoring website traffic and interactions
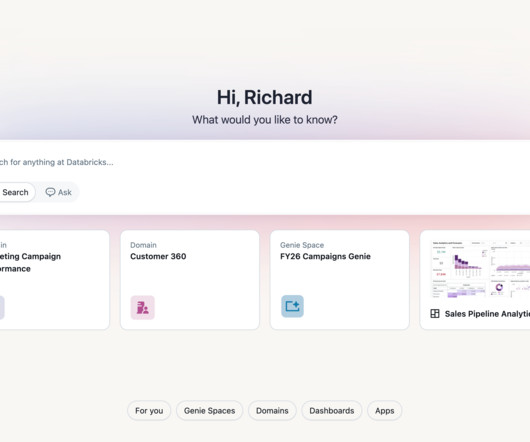
The Future of Databricks One This is just the beginning for Databricks One. Keep up with us Subscribe Recommended for you Share this post Never miss a Databricks post Subscribe to the categories you care about and get the latest posts delivered to your inbox Sign up What's next?
Spencer Czapiewski September 12, 2024 - 8:38pm Karen Madera Senior Manager, Product Marketing, Tableau We’re in the midst of an autonomous revolution that’s reshaping the way businesses use data to gain a competitive edge, delight customers, and engage employees.
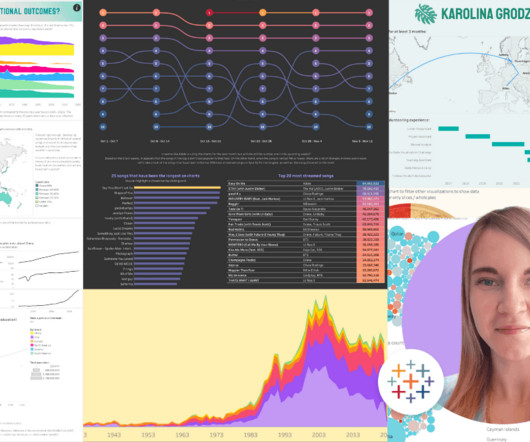
Ateken Abla March 19, 2024 - 9:05pm Larissa Amoroso Vice President, Tableau Community, Tableau When Karolina Grodzinska took the stage at Tableau Conference as part of her Iron Viz: Student Edition award, it felt like the culmination of her data learning, which started in 2021. How did Karolina discover Tableau? “It
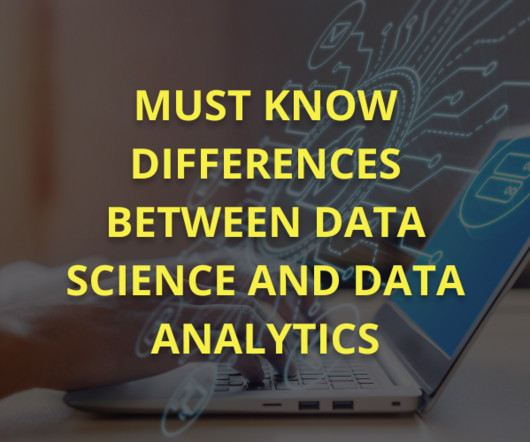
Summary: Data Visualisation is crucial to ensure effective representation of insights tableau vs power bi are two popular tools for this. This article compares Tableau and Power BI, examining their features, pricing, and suitability for different organisations. billion in 2024 and reach USD 63.76 What is Tableau?
Ateken Abla July 9, 2024 - 7:30pm Danika Harrod Marketing Manager, Community Content & Events, Tableau How did Paul go from Tableau beginner to winning Iron Viz at his first attempt? Paul Ross is living proof that the Iron Viz title is possible for Tableau users of all skill-levels, from beginners to experts.
Comparison with related concepts Business analytics intersects with several related fields, each with its nuances. Businessintelligence (BI) While BI assesses past operations and delivers historical data insights, business analytics aims to predict future trends based on these insights.
Tableau Public Tableau Public , a powerful data visualization software, empowers users to create interactive and shareable dashboards with ease. What sets Tableau apart is its intuitive, user-friendly, drag-and-drop interface. Other elements make Tableau Public an excellent choice for data visualization experts.
It is commonly used for analytics and businessintelligence, helping organisations make data-driven decisions. It allows businesses to store and analyse large datasets without worrying about infrastructure management. Looker : A businessintelligence tool for data exploration and visualization.
EVENT — ODSC East 2024 In-Person and Virtual Conference April 23rd to 25th, 2024 Join us for a deep dive into the latest data science and AI trends, tools, and techniques, from LLMs to data analytics and from machine learning to responsible AI. The best way to do that is by joining us at ODSC’s Data Engineering Summit and ODSC East.
In 2024, they face emerging trends such as automation and agile methodologies, requiring a diverse skill set. These professionals play a vital part in analysing and optimising business processes, ensuring that companies can achieve their strategic goals effectively.
Tableau and Power BI : Visualisation tools that create interactive dashboards and reports. billion in 2024 and is expected to grow to $676.51 This growth highlights the need for businessintelligence, reporting, and trend analysis professionals. Data Analysts primarily use SQL, Excel, and visualisation tools like Tableau.
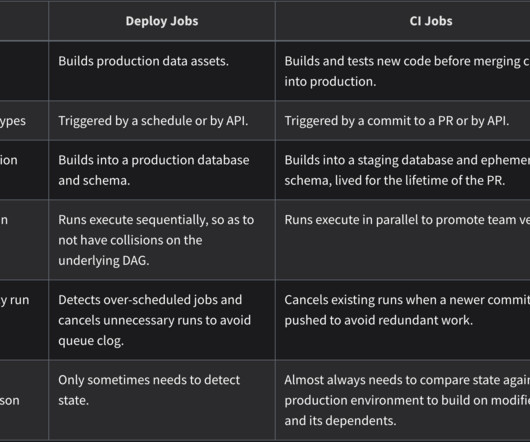
Seamless Integration with Downstream Tools: The setup process is tailored to enable consistent metric access across a variety of analytics and businessintelligence tools. Tableau (beta) Google Sheets (beta) Hex Klipfolio PowerMetrics Lightdash Mode Push.ai
Python, the language that became the most used language in 2024, is the top choice for job seekers who want to pursue any career in AI. Data Analysis and Transition to Machine Learning: Skills: Python, SQL, Excel, Tableau and Power BI are relevant skills for entry-level data analysis roles. However, the competition is high.
We organize all of the trending information in your field so you don't have to. Join 17,000+ users and stay up to date on the latest articles your peers are reading.
You know about us, now we want to get to know you!
Let's personalize your content
Let's get even more personalized
We recognize your account from another site in our network, please click 'Send Email' below to continue with verifying your account and setting a password.


Let's personalize your content