This site uses cookies to improve your experience. To help us insure we adhere to various privacy regulations, please select your country/region of residence. If you do not select a country, we will assume you are from the United States. Select your Cookie Settings or view our Privacy Policy and Terms of Use.
Cookie Settings
Cookies and similar technologies are used on this website for proper function of the website, for tracking performance analytics and for marketing purposes. We and some of our third-party providers may use cookie data for various purposes. Please review the cookie settings below and choose your preference.
Used for the proper function of the website
Used for monitoring website traffic and interactions
Cookie Settings
Cookies and similar technologies are used on this website for proper function of the website, for tracking performance analytics and for marketing purposes. We and some of our third-party providers may use cookie data for various purposes. Please review the cookie settings below and choose your preference.
Strictly Necessary: Used for the proper function of the website
Performance/Analytics: Used for monitoring website traffic and interactions
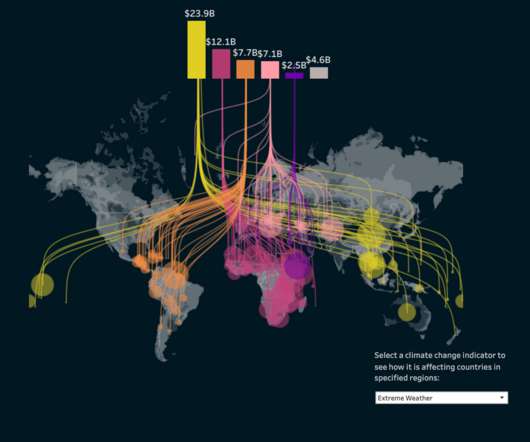
Can it do decent quantitative analysis from a datavisualization? For me, one of the most useful GPT-4 tools is the ability to analyze and interpret image data. But how good it this tool now with charting data and with map images? GPT-4o also provides overview of the range,… Read the full blog for free on Medium.
Can it do decent quantitative analysis from a datavisualization? For me, one of the most useful GPT-4 tools is the ability to analyze and interpret image data. But how good it this tool now with charting data and with map images? GPT-4o also provides overview of the range,… Read the full blog for free on Medium.
The field of data science has evolved dramatically over the past several years, driven by technological breakthroughs, industry demands, and shifting priorities within the community. This blog explores how different topics gained momentum, which areas declined, and what this tells us about the future of datascience.
It seems like that's not the main focus of your org, but I was pleased to see a reference to RCV in your blog: [0] [0]: https://goodparty.org/blog/article/final-five-voting-explain. It was acquired by Airtable in 2021. Based in NYC (Chinatown). About the team - I'm Justin (CEO).
From the latest developments to guiding people through the thorns of career, Analytics Vidhya has it all in its blog archives. The post Top Data Science Guest Authors of 2021 appeared first on Analytics Vidhya. And this would not have been possible without leveraging the power of the […].
November 6, 2021 - 2:57am. November 6, 2021. In just a few days, we’ll all be watching—and I’ll be co-hosting for the fourth time— Iron Viz , the ultimate visualization showdown, at #Data21. Gary Li , The Data School Australia. Guest Blog Post: This is Pink Floyd - Remastered. Adam Mico , guest blog on Bootcamp.
September 30, 2021 - 4:55pm. October 2, 2021. If you’ve ever had a conversation with me about datavisualization, you know I’m passionate about color usage. For updates throughout the month, follow me Twitter and LinkedIn , and check out the list of blogs that Andy Cotgreave and I follow for Best of the Tableau Web.
December 11, 2021 - 1:33am. December 11, 2021. Tune into Tableau Conference 2021 on-demand. For updates throughout the month, follow me Twitter and LinkedIn , and check out the list of blogs that Andy Cotgreave and I follow for Best of the Tableau Web. My highlights from Tableau Conference 2021. Visualizations.
November 6, 2021 - 2:57am. November 6, 2021. In just a few days, we’ll all be watching—and I’ll be co-hosting for the fourth time— Iron Viz , the ultimate visualization showdown, at Tableau Conference. Gary Li , The Data School Australia. Guest Blog Post: This is Pink Floyd - Remastered. Andy Cotgreave.
November 12, 2021 - 12:25am. November 12, 2021. Tableau celebrated its 14th annual Tableau Conference—and the largest data party of the year drew data rockstars from all over the globe to learn, connect, and be inspired by their peers, experts, and thought leaders. Kristin Adderson.
December 11, 2021 - 1:33am. December 11, 2021. Tune into Tableau Conference 2021 on-demand. For updates throughout the month, follow me Twitter and LinkedIn , and check out the list of blogs that Andy Cotgreave and I follow for Best of the Tableau Web. My highlights from Tableau Conference 2021. Visualizations.
Three I’m excited about are Back 2 Viz Basics , Data Plus Music and Games Night Viz. Whether you write blogs (like Donna Coles) or do videos, articulating your learnings cements them in your own mind. Nicole Klassan and Oana Tudorancea's visualization for #VizCollab. Data viz Colors: The Good the Bad (and the Ugly).
September 30, 2021 - 4:55pm. October 2, 2021. If you’ve ever had a conversation with me about datavisualization, you know I’m passionate about color usage. For updates throughout the month, follow me Twitter and LinkedIn , and check out the list of blogs that Andy Cotgreave and I follow for Best of the Tableau Web.
February 12, 2021 - 4:30pm. February 13, 2021. That blog post led me to the community forums, and the rest is history. I’m now part of Tableau (having joined in 2019) and recently created Real World Fake Data (RWFD) to scratch an itch for business-ready dashboards for the DataFam community. Blogs are a funny thing.
November 12, 2021 - 12:25am. November 12, 2021. Tableau celebrated its 14th annual Tableau Conference—and the largest data party of the year drew data rockstars from all over the globe to learn, connect, and be inspired by their peers, experts, and thought leaders. Kristin Adderson.
Three I’m excited about are Back 2 Viz Basics , Data Plus Music and Games Night Viz. Whether you write blogs (like Donna Coles) or do videos, articulating your learnings cements them in your own mind. Nicole Klassan and Oana Tudorancea's visualization for #VizCollab. Data viz Colors: The Good the Bad (and the Ugly).
November 10, 2021 - 1:09am. November 10, 2021. It wouldn't be Tableau Conference without the world’s ultimate data showdown—Iron Viz. Three fierce contestants took the virtual stage to rock day two with some visualization madness. This officially ends 2021 Iron Viz. Andrew Grinaker. Ateken Abla. What's next?
November 10, 2021 - 1:09am. November 10, 2021. It wouldn't be Tableau Conference without the world’s ultimate data showdown—Iron Viz. Three fierce contestants took the virtual stage to rock day two with some visualization madness. This officially ends 2021 Iron Viz. Andrew Grinaker. Ateken Abla. What's next?
February 12, 2021 - 4:30pm. February 13, 2021. That blog post led me to the community forums, and the rest is history. I’m now part of Tableau (having joined in 2019) and recently created Real World Fake Data (RWFD) to scratch an itch for business-ready dashboards for the DataFam community. Blogs are a funny thing.
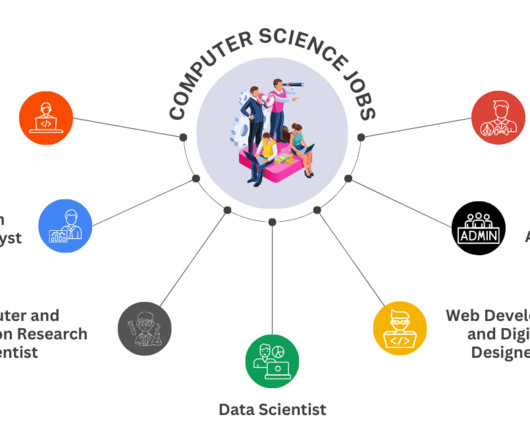
According to the Bureau of Labor Statistics , the outlook for information technology and computer science jobs is projected to grow by 15 percent between 2021 and 2031, a rate much faster than the average for all occupations. In this blog, we will explore the top computer science major jobs for individuals.
Welcome to Best of Tableau Web—a monthly highlight of tips, tricks, and inspiration from across the internet on Tableau and datavisualization. I want to shout out to all the Community members providing content and blogs to the Tableau Community in multiple languages and making data skills more accessible across the world.
Welcome to Best of Tableau Web—a monthly highlight of tips, tricks, and inspiration from across the internet on Tableau and datavisualization. I want to shout out to all the Community members providing content and blogs to the Tableau Community in multiple languages and making data skills more accessible across the world.
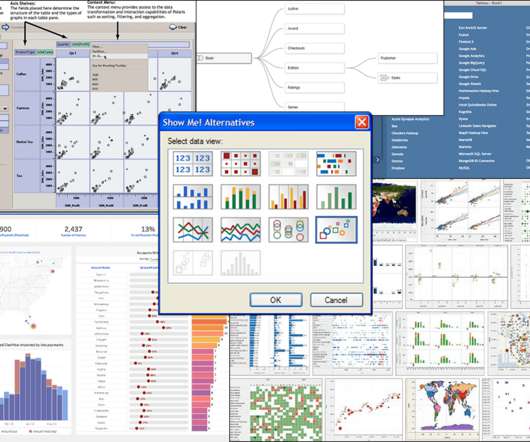
November 30, 2021 - 4:55am. November 30, 2021. Tableau is an innovator in the field of datavisualization with its ease of use, stunning visualizations, vibrant community, and more contributing to success. A single blog post won’t do justice to the entire ecosystem of open source tools that surround Tableau.
Data analysts are in high demand: From technology giants like IBM and Microsoft to our favorite media streaming providers like Netflix and Amazon Prime, organizations are increasingly relying on data analytics to make smart business decisions. […].
November 30, 2021 - 4:55am. November 30, 2021. Tableau is an innovator in the field of datavisualization with its ease of use, stunning visualizations, vibrant community, and more contributing to success. A single blog post won’t do justice to the entire ecosystem of open source tools that surround Tableau.
October 11, 2021 - 5:30pm. October 21, 2021. We are just weeks away from Tableau Conference and the ultimate visualization showdown —Iron Viz 2021—where three fierce contestants will take the virtual stage for an intense lightning round of live viz-tastic storytelling. . Meet the 2021 Iron Viz Finalists.
October 11, 2021 - 5:30pm. October 21, 2021. We are just weeks away from Tableau Conference and the ultimate visualization showdown —Iron Viz 2021—where three fierce contestants will take the virtual stage for an intense lightning round of live viz-tastic storytelling. . Meet the 2021 Iron Viz Finalists.
According to the IT Sustainability Beyond the Data Center report from the IBM Institute for Business Value, some estimates suggest that there has been a 43% absolute increase in the power capacity demand by data center operators between 2018 and 2021, and that the global data center market will grow by more than 30% between 2021 and 2027.
Software developer Khadeja joined us as an intern in 2021 and 2022, and made a great impression straight away. In the summer of 2021, I was in the second year of my BSc. My Friday experiments with Cambridge Intelligence’s unique datavisualization toolkits started with a fun fraud visualization app.
December 1, 2021 - 11:06pm. December 2, 2021. Innovation is necessary to use data effectively in the pursuit of a better world, particularly because data continues to increase in size and richness. Visual encoding, in particular, tapped the power of the human visual system. March 2021). Bronwen Boyd.
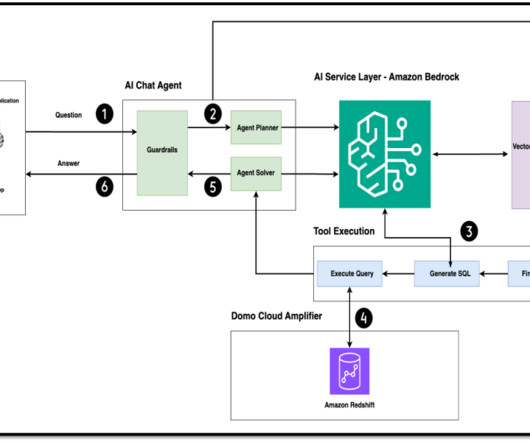
Domo works with organizations that place a strong emphasis on deriving actionable insights from their data assets. Domo’s existing solution already enables these organizations to extract valuable insights through datavisualization and analysis.
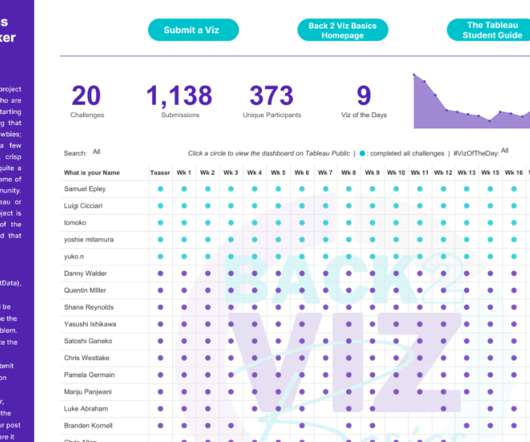
If you’re looking for a fun way to connect with data enthusiasts while also reinforcing foundational datavisualization skills, Back to Viz Basics (B2VB)—a Tableau Community Project—is the perfect place to start. I’ll be expanding on the current blog and interviews as well as kicking off a NEW COMMUNITY PROJECT! (1/3).
If you’re looking for a fun way to connect with data enthusiasts while also reinforcing foundational datavisualization skills, Back to Viz Basics (B2VB)—a Tableau Community Project—is the perfect place to start. I’ll be expanding on the current blog and interviews as well as kicking off a NEW COMMUNITY PROJECT! (1/3).
If you’re looking for a fun way to connect with data enthusiasts while also reinforcing foundational datavisualization skills, Back to Viz Basics (B2VB)—a Tableau Community Project—is the perfect place to start. I’ll be expanding on the current blog and interviews as well as kicking off a NEW COMMUNITY PROJECT! (1/3).
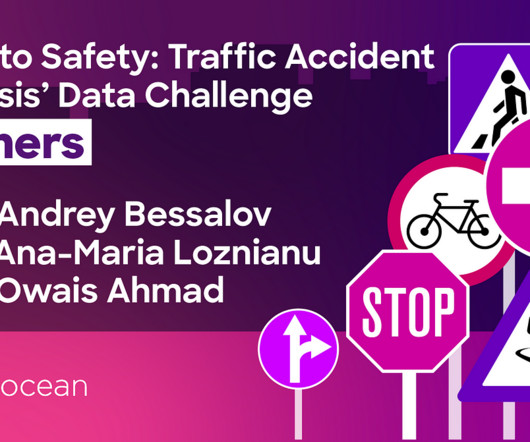
Key Discoveries Participants delved into over a decade’s worth of traffic accident data, uncovering patterns and trends that could inform future safety measures. This map also provides an example of proficient Datavisualization, transformation, and delivery. Hospitalet de Llobregat: 392 accidents 6. Tarragona: 388 accidents 7.
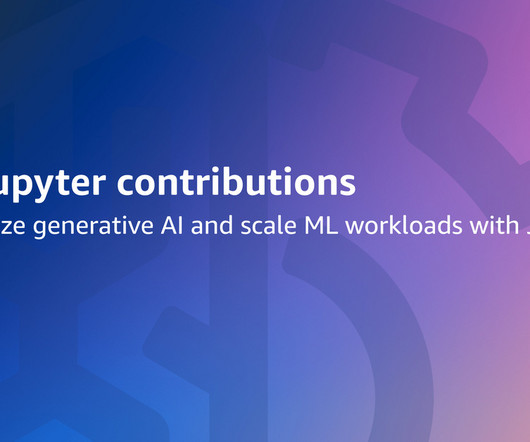
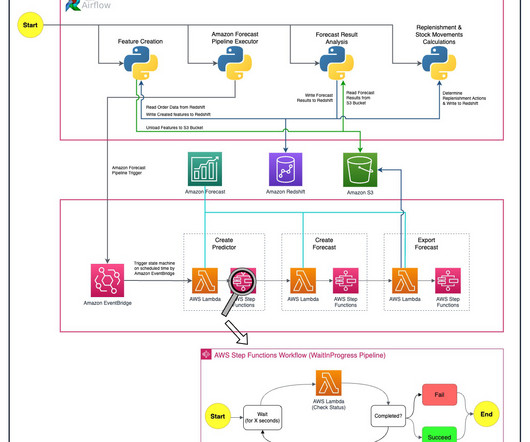
Tens of thousands of customers are using Studio to empower data science teams of all sizes. In 2021, we further extended the benefits of SageMaker to the community of millions of Jupyter users by launching Amazon SageMaker Studio Lab —a free notebook service, again based on JupyterLab, that includes free compute and persistent storage.
He worked at Turkcell, mainly focused on time series forecasting, datavisualization, and network automation. He joined Getir in 2021 and currently works as a Data Science & Analytics Manager with the responsibility of Search, Recommendation, and Growth domains.
He worked at Turkcell, mainly focused on time series forecasting, datavisualization, and network automation. He joined Getir in 2021 and currently works as a Lead Data Scientist with the responsibility of Search & Recommendation Engine and Customer Behavior Models.
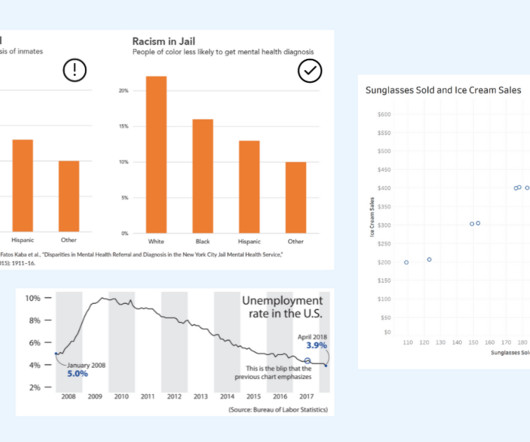
Andy Cotgreave , Senior Data Evangelist, Tableau at Salesforce To aid your thoughtful review of charts, we created a handy 4 part checklist with an easy to remember acronym, SCAM. This blog will cover the fourth part of the checklist—reviewing the message. A perfect follow-on after reading this blog! Be aware of the SCAM!
He worked at Turkcell, mainly focused on time series forecasting, datavisualization, and network automation. He joined Getir in 2021 and currently works as a Data Science & Analytics Manager with the responsibility of Search, Recommendation, and Growth domains.
Health care organizations across the world are in varying stages of maturity when it comes to data and working with their data assets. Sure, they all store and manage their data in some way, but in 2021, I hope forward-thinking organizations are addressing the key questions. What’s […].
It is the process of converting raw data into relevant and practical knowledge to help evaluate the performance of businesses, discover trends, and make well-informed choices. Data gathering, data integration, data modelling, analysis of information, and datavisualization are all part of intelligence for businesses.
Two of the platforms that we see emerging as a popular combination of data warehousing and business intelligence are the Snowflake Data Cloud and Power BI. Debuting in 2015, Power BI has undergone meaningful updates that have made it a leader not just in datavisualization, but in the business intelligence space as well.
We organize all of the trending information in your field so you don't have to. Join 17,000+ users and stay up to date on the latest articles your peers are reading.
You know about us, now we want to get to know you!
Let's personalize your content
Let's get even more personalized
We recognize your account from another site in our network, please click 'Send Email' below to continue with verifying your account and setting a password.


Let's personalize your content