Remove 2020 Remove Business Intelligence Remove Data Visualization
article thumbnail

6 Top Tools for Analytics and Business Intelligence in 2020

Analytics Vidhya

Overview Analytics and Business Intelligence provide comprehensible view of the company and derive actionable insights. We’ll discuss 6 top business intelligence tools that you. The post 6 Top Tools for Analytics and Business Intelligence in 2020 appeared first on Analytics Vidhya.

article thumbnail

Gartner’s 2020 Magic Quadrant is Out! Check out the latest developments in Best Analytics Tools

Analytics Vidhya

What’s the best Business Intelligence and Analytics tool in the market? A plethora of data science and business intelligence professionals and organizations have asked. The post Gartner’s 2020 Magic Quadrant is Out!

Analytics 394
professionals

Sign Up for our Newsletter

This site is protected by reCAPTCHA and the Google Privacy Policy and Terms of Service apply.

article thumbnail

Tableau: 9 years a Leader in Gartner Magic Quadrant for Analytics and Business Intelligence Platforms

Tableau

This week, Gartner published the 2021 Magic Quadrant for Analytics and Business Intelligence Platforms. I first want to thank you, the Tableau Community, for your continued support and your commitment to data, to Tableau, and to each other. Francois Ajenstat. Kristin Adderson. January 27, 2021 - 4:36pm. February 18, 2021.

Tableau 102
article thumbnail

Tableau: 9 years a Leader in Gartner Magic Quadrant for Analytics and Business Intelligence Platforms

Tableau

This week, Gartner published the 2021 Magic Quadrant for Analytics and Business Intelligence Platforms. I first want to thank you, the Tableau Community, for your continued support and your commitment to data, to Tableau, and to each other. Francois Ajenstat. Kristin Adderson. January 27, 2021 - 4:36pm. February 18, 2021.

Tableau 52
article thumbnail

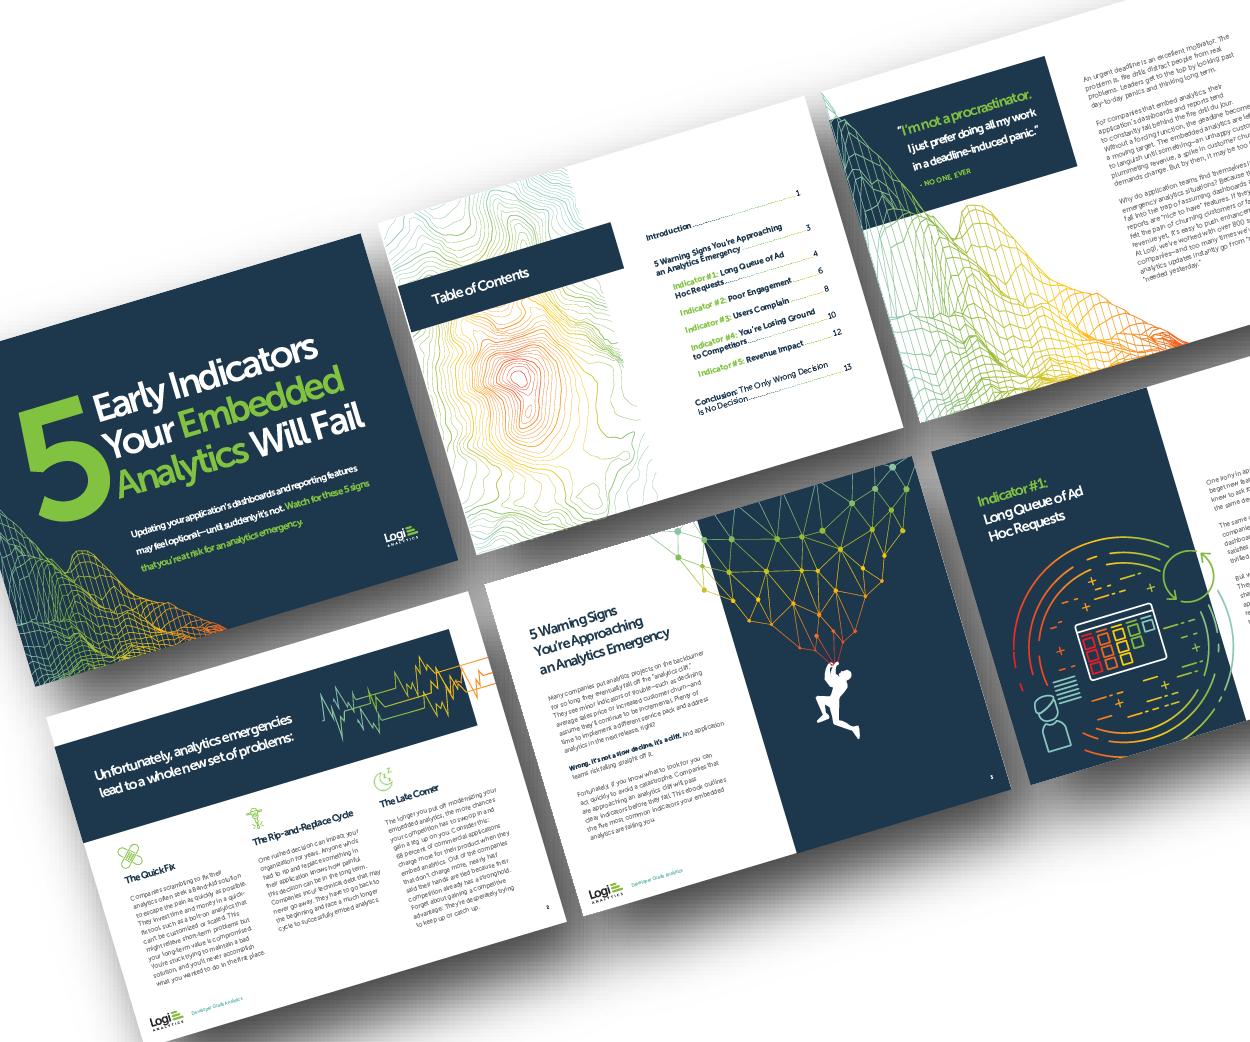
5 Early Indicators Your Embedded Analytics Will Fail

Many application teams leave embedded analytics to languish until something—an unhappy customer, plummeting revenue, a spike in customer churn—demands change. But by then, it may be too late. In this White Paper, Logi Analytics has identified 5 tell-tale signs your project is moving from “nice to have” to “needed yesterday.".

article thumbnail

How to Optimize Power BI and Snowflake for Advanced Analytics

phData

How to Optimize Power BI and Snowflake for Advanced Analytics Spencer Baucke May 25, 2023 The world of business intelligence and data modernization has never been more competitive than it is today. Microsoft Power BI has been the leader in the analytics and business intelligence platforms category for several years running.

article thumbnail

Analyzing the history of Tableau innovation

Tableau

Innovation is necessary to use data effectively in the pursuit of a better world, particularly because data continues to increase in size and richness. April 2018), which focused on users who do understand joins and curating federated data sources. Visual encoding, in particular, tapped the power of the human visual system.

Tableau 145