Remove 2018 Remove Analytics Remove Clean Data
article thumbnail

Tableau: 9 years a Leader in Gartner Magic Quadrant for Analytics and Business Intelligence Platforms

Tableau

This week, Gartner published the 2021 Magic Quadrant for Analytics and Business Intelligence Platforms. I first want to thank you, the Tableau Community, for your continued support and your commitment to data, to Tableau, and to each other. Accelerate adoption with intuitive analytics that people love to use. Francois Ajenstat.

Tableau 102
article thumbnail

Predict football punt and kickoff return yards with fat-tailed distribution using GluonTS

Flipboard

With advanced analytics derived from machine learning (ML), the NFL is creating new ways to quantify football, and to provide fans with the tools needed to increase their knowledge of the games within the game of football. The player tracking data contains the player’s position, direction, acceleration, and more (in x,y coordinates).

professionals

Sign Up for our Newsletter

This site is protected by reCAPTCHA and the Google Privacy Policy and Terms of Service apply.

article thumbnail

Tableau: 9 years a Leader in Gartner Magic Quadrant for Analytics and Business Intelligence Platforms

Tableau

This week, Gartner published the 2021 Magic Quadrant for Analytics and Business Intelligence Platforms. I first want to thank you, the Tableau Community, for your continued support and your commitment to data, to Tableau, and to each other. Accelerate adoption with intuitive analytics that people love to use. Francois Ajenstat.
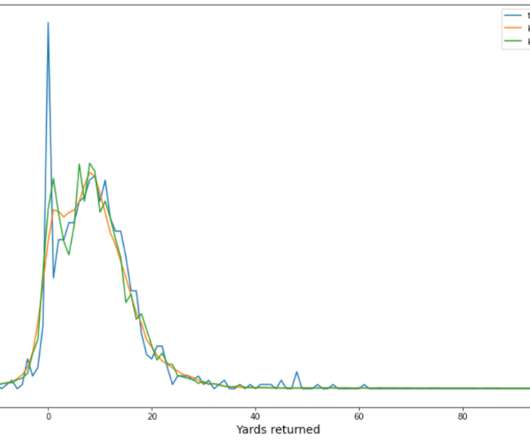
Tableau 52
article thumbnail

Introduction to Autoencoders

Flipboard

By using our mathematical notation, the entire training process of the autoencoder can be written as follows: Figure 2 demonstrates the basic architecture of an autoencoder: Figure 2: Architecture of Autoencoder (inspired by Hubens, “Deep Inside: Autoencoders,” Towards Data Science , 2018 ).

article thumbnail

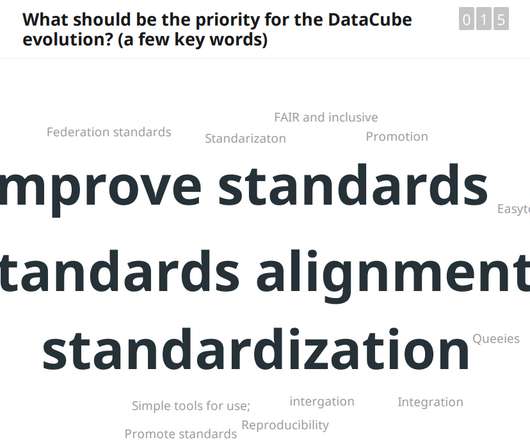
Present and future of data cubes: an European EO perspective

Mlearning.ai

It can be gradually “enriched” so the typical hierarchy of data is thus: Raw dataCleaned data ↓ Analysis-ready data ↓ Decision-ready data ↓ Decisions. For example, vector maps of roads of an area coming from different sources is the raw data. 2018, July). Remote Sensing, 12(24), 4033.

AWS 98
article thumbnail

Identifying defense coverage schemes in NFL’s Next Gen Stats

AWS Machine Learning Blog

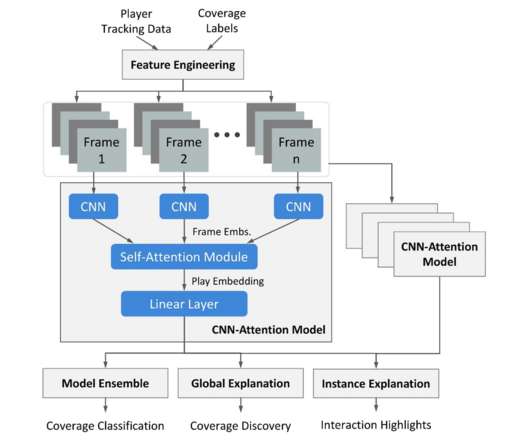
For instance, it can reveal the preferences of play callers, allow deeper understanding of how respective coaches and teams continuously adjust their strategies based on their opponent’s strengths, and enable the development of new defensive-oriented analytics such as uniqueness of coverages ( Seth et al. ).

ML 98
article thumbnail

Why We Started the Data Intelligence Project

Alation

In 2018, American Family Insurance became an Alation customer and I became the product owner for the AmFam catalog program. In the 2010s, the growing scope of the data landscape gave rise to a new profession: the data scientist. degrees in Data Engineering over the past 2 years, while others have expanded existing M.S.