This site uses cookies to improve your experience. To help us insure we adhere to various privacy regulations, please select your country/region of residence. If you do not select a country, we will assume you are from the United States. Select your Cookie Settings or view our Privacy Policy and Terms of Use.
Cookie Settings
Cookies and similar technologies are used on this website for proper function of the website, for tracking performance analytics and for marketing purposes. We and some of our third-party providers may use cookie data for various purposes. Please review the cookie settings below and choose your preference.
Used for the proper function of the website
Used for monitoring website traffic and interactions
Cookie Settings
Cookies and similar technologies are used on this website for proper function of the website, for tracking performance analytics and for marketing purposes. We and some of our third-party providers may use cookie data for various purposes. Please review the cookie settings below and choose your preference.
Strictly Necessary: Used for the proper function of the website
Performance/Analytics: Used for monitoring website traffic and interactions
Cloud analytics is one example of a new technology that has changed the game. Let’s delve into what cloud analytics is, how it differs from on-premises solutions, and, most importantly, the eight remarkable ways it can propel your business forward – while keeping a keen eye on the potential pitfalls.
This week, Gartner published the 2021 Magic Quadrant for Analytics and BusinessIntelligence Platforms. In every release, we're making Tableau easier to use, more powerful, and simpler to deploy to support governed data and analytics at scale. Accelerate adoption with intuitive analytics that people love to use.
Tableau has been named a Leader in the Gartner Magic Quadrant for Analytics & BusinessIntelligence Platforms for the 10th consecutive year. Introduced Slack-first analytics to put data in the flow of work —and at the center of every conversation. Empower everyone with analytics. Put analytics in the flow of work.
Tableau has been named a Leader in the Gartner Magic Quadrant for Analytics & BusinessIntelligence Platforms for the 10th consecutive year. Introduced Slack-first analytics to put data in the flow of work —and at the center of every conversation. Empower everyone with analytics. Put analytics in the flow of work.
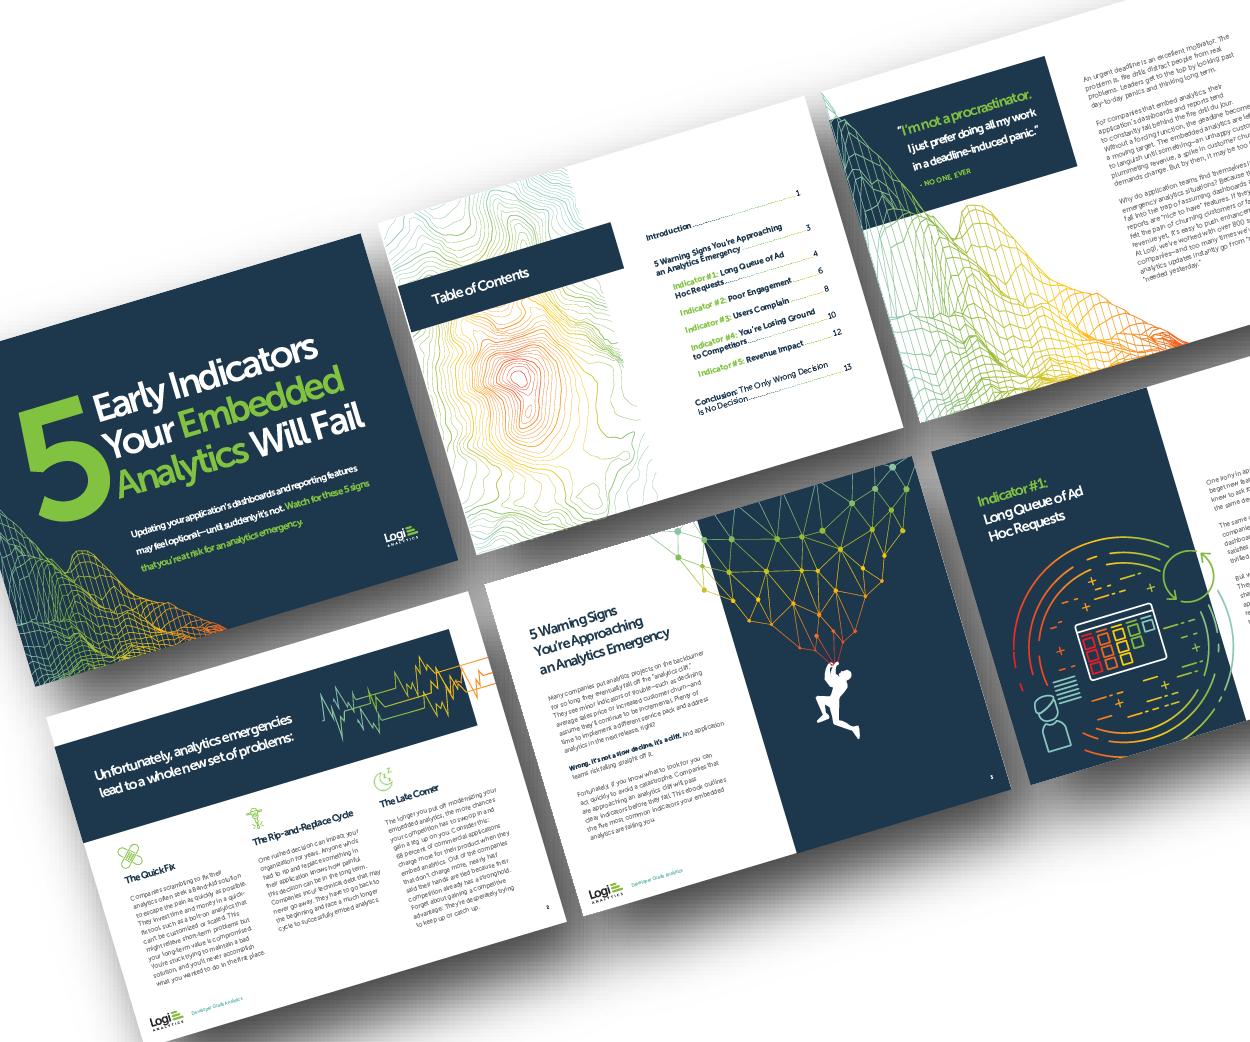
Many application teams leave embedded analytics to languish until something—an unhappy customer, plummeting revenue, a spike in customer churn—demands change. In this White Paper, Logi Analytics has identified 5 tell-tale signs your project is moving from “nice to have” to “needed yesterday.". Brought to you by Logi Analytics.
Earlier this month without nearly the grandiose fanfare or market madness of Gartner Magic Quadrant releases, the Gartner Critical Capabilities for Analytics and BusinessIntelligence Platforms Report 2018 was quietly. Read More.
This week, Gartner published the 2021 Magic Quadrant for Analytics and BusinessIntelligence Platforms. In every release, we're making Tableau easier to use, more powerful, and simpler to deploy to support governed data and analytics at scale. Accelerate adoption with intuitive analytics that people love to use.
How to Optimize Power BI and Snowflake for Advanced Analytics Spencer Baucke May 25, 2023 The world of businessintelligence and data modernization has never been more competitive than it is today. Much of what is discussed in this guide will assume some level of analytics strategy has been considered and/or defined.
According to a survey published by Qlik (a company specializing in analytics and BusinessIntelligence), 25% of Spaniards surveyed are fluent in understanding and managing data for their daily projects, compared to 17% of the European average. They are the European leader in big data decisionmaking.
For example, airlines have historically applied analytics to revenue management, while successful hospitality leaders make data-driven decisions around property allocation and workforce management. Why is data analytics important for travel organizations? Today, modern travel and tourism thrive on data.
This was an eventful year in the world of data and analytics. Amid the headline grabbing news, 2018 will also be remembered as the year of the data catalog. At Alation, 2018 was a banner year with incredible adoption, including new customers like American Family Insurance, BMW, Daimler, Munich Re , and Pepsico.
To address these challenges, Al Rabie partnered with 1Direction Global, a top solution provider in Financial and Operational Performance Management and Consulting, and a Gold Business Partner with IBM since 2018. The most fulfilling solution has been selected was IBM Planning Analytics with Watson. Ltd was no exception.
Tableau has been helping people and organizations to see and understand data for almost two decades, bringing exciting innovations to the landscape of businessintelligence with every product release. And with this work, I invite discussions about this history, my analysis, and the implications for the future of analytics.
This week, two independent analyst reports validated what we’ve known for years – data catalogs are critical for self-service analytics.[1]. After investing in self-service analytic tooling, organizations are now turning their attention to linking infrastructure and tooling to data-driven decisions. A New Market Category.
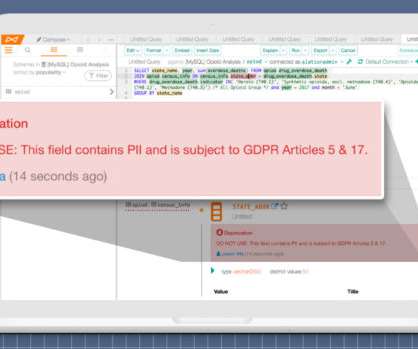
. ; there has to be a business context, and the increasing realization of this context explains the rise of information stewardship applications.” – May 2018 Gartner Market Guide for Information Stewardship Applications. The rise of data lakes, IOT analytics, and big data pipelines has introduced a new world of fast, big data.
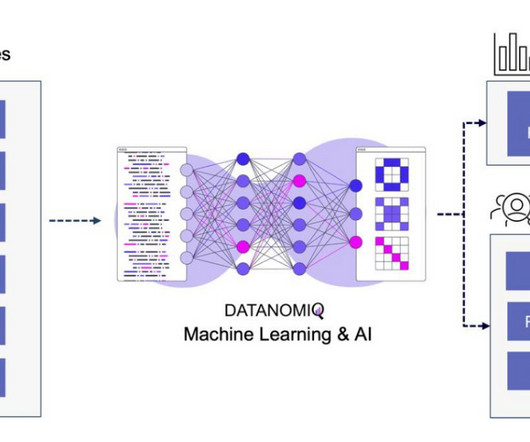
First, a robust data platform (such as a customer data platform; CDP) that can integrate data from various sources, such as tracking systems, ERP systems, e-commerce platforms to effectively perform data analytics. For more information on how to calculate the marginal distribution, see Zhao et al. References Zhao, K., Mahboobi, S.
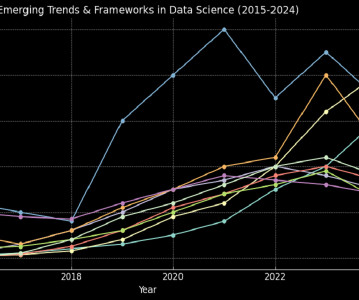
The Early Years: Laying the Foundations (20152017) In the early years, data science conferences predominantly focused on foundational topics like data analytics , visualization , and the rise of big data. The Deep Learning Boom (20182019) Between 2018 and 2019, deep learning dominated the conference landscape.
Tableau has been helping people and organizations to see and understand data for almost two decades, bringing exciting innovations to the landscape of businessintelligence with every product release. And with this work, I invite discussions about this history, my analysis, and the implications for the future of analytics.
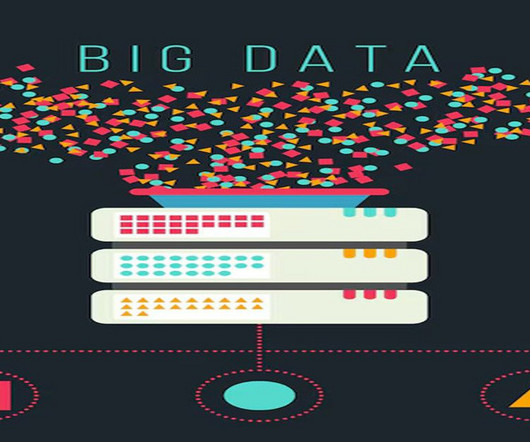
Key components include data storage solutions, processing frameworks, analytics tools, and governance practices. According to a report by Statista, the global data sphere is expected to reach 180 zettabytes by 2025 , a significant increase from 33 zettabytes in 2018. What is Big Data?
Key components include data storage solutions, processing frameworks, analytics tools, and governance practices. According to a report by Statista, the global data sphere is expected to reach 180 zettabytes by 2025 , a significant increase from 33 zettabytes in 2018. What is Big Data?
Two decades on, the role has expanded to include responsibility for analytics, and even data monetization. Between 2010 and 2018 the number of CDOs present in Fortune 1500 companies increased nearly 8-fold. Promoting Self-Service Analytics. As the role’s obligations have increased, so too has its prevalence.
Dann etwa im Jahr 2018 flachte der Hype um Big Data wieder ab, die Euphorie änderte sich in eine Ernüchterung, zumindest für den deutschen Mittelstand. Google Trends – Big Data (blue), Data Science (red), BusinessIntelligence (yellow) und Process Mining (green). Artificial Intelligence (AI) ersetzt.
LinkedIn: https://www.linkedin.com/in/edwin-genego/ Throughout my career since 2018 I have primarily been a Python and Django developer, with a unintentional pivot to AI integrations & engineering in 2022/2023.
We organize all of the trending information in your field so you don't have to. Join 17,000+ users and stay up to date on the latest articles your peers are reading.
You know about us, now we want to get to know you!
Let's personalize your content
Let's get even more personalized
We recognize your account from another site in our network, please click 'Send Email' below to continue with verifying your account and setting a password.


Let's personalize your content