Remove 2016 Remove 2023 Remove Data Visualization
article thumbnail

How to Spot Misleading Charts, a Checklist

Tableau

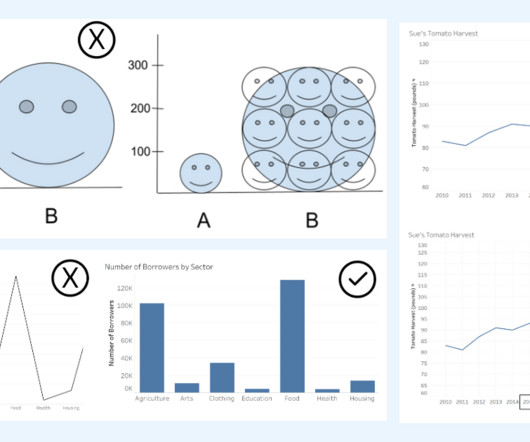
Alyssa Jenson November 14, 2023 - 6:59pm Sue Kraemer Senior Data Skills Curriculum Strategy Manager, Tableau Charts are all around us. In today’s world, the ability to swiftly make decisions and act on data is crucial. Two line graphs showing the same data with different intervals on the axis. Know the Source.

article thumbnail

My experience at Cambridge Intelligence

Cambridge Intelligence

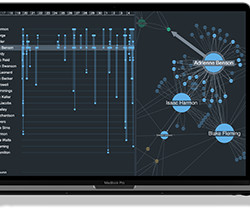
With my background in web development and JavaScript, I had options – but an internship with Cambridge Intelligence was special as it promised to immerse me in the fascinating world of data visualization, a field I had explored during my research projects at Loughborough University.

professionals

Sign Up for our Newsletter

This site is protected by reCAPTCHA and the Google Privacy Policy and Terms of Service apply.

article thumbnail

Beyond the Checkered Flag: F1 Statistics Explored

Towards AI

Last Updated on November 18, 2023 by Editorial Team Author(s): Vishnu Regimon Nair Originally published on Towards AI. Analyzing F1 from a fan and data science perspective could help gain useful insights. Photo by Cr-AI-tive on Pixabay In an extremely competitive sport like F1, even the tiniest performance gains can lead to victory.

Tableau 119
article thumbnail

Michael I. Jordan of Berkeley on Learning-Aware Mechanism Design

ODSC - Open Data Science

He received the Ulf Grenander Prize from the American Mathematical Society in 2021, the IEEE John von Neumann Medal in 2020, the IJCAI Research Excellence Award in 2016, the David E. Rumelhart Prize in 2015, and the ACM/AAAI Allen Newell Award in 2009.

article thumbnail

Announcing new Jupyter contributions by AWS to democratize generative AI and scale ML workloads

AWS Machine Learning Blog

That is why we announced the general availability of Amazon CodeWhisperer earlier in 2023. To remove the manual work and improve productivity, we are excited to announce a new open-source distribution that includes the most popular packages for ML, data science, and data visualization.

ML 104
article thumbnail

Announcing the Winners of ‘The NFL Fantasy Football’ Data Challenge

Ocean Protocol

This data challenge took NFL player performance data and fantasy points from the last 6 seasons to calculate forecasted points to be scored in the 2024 NFL season that began Sept. This report took the data set provided in the challenge, as well as external data feeds and alternative sources.

article thumbnail

New projects contribute to digital commons

Hacker News

In 12 years raylib has greatly went beyond education to many other fields and today its being used for videogames development, tools development, data visualization, graphics programming, academic research, embedded devices and, in general, for low-level graphics output in any kind of display. 101135429 ).

EDA 62