Remove 2014 Remove Analytics Remove Clustering
article thumbnail

Understanding and predicting urban heat islands at Gramener using Amazon SageMaker geospatial capabilities

AWS Machine Learning Blog

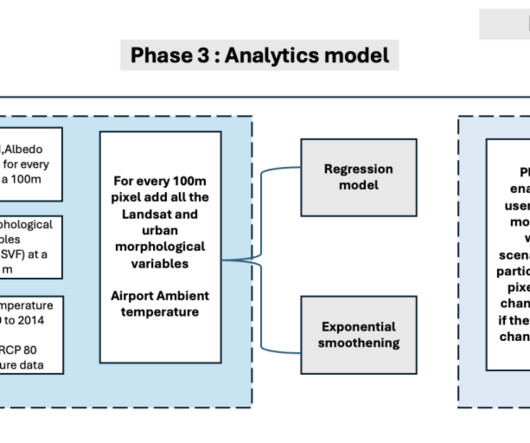
This analytical model provides accurate estimates of land surface temperature (LST) at a granular level, allowing Gramener to quantify changes in the UHI effect based on parameters (names of indexes and data used). Solution overview Geobox aims to analyze and predict the UHI effect by harnessing spatial characteristics.

article thumbnail

What is the Snowflake Data Cloud and How Much Does it Cost?

phData

If you go back to 2014, data warehouse platforms were built using legacy architectures that had drawbacks when it came to cost, scale, and flexibility. Data Analytics: It supports complex data analytics workloads, enabling organizations to run ad-hoc queries, perform data exploration, and generate insights from their data.

professionals

Sign Up for our Newsletter

This site is protected by reCAPTCHA and the Google Privacy Policy and Terms of Service apply.

article thumbnail

Federated Learning on AWS with FedML: Health analytics without sharing sensitive data – Part 2

AWS Machine Learning Blog

They were admitted to one of 335 units at 208 hospitals located throughout the US between 2014–2015. Finally, monitor and track the FL model training progression across different nodes in the cluster using the weights and biases (wandb) tool, as shown in the following screenshot.

AWS 101
article thumbnail

Best Egg achieved three times faster ML model training with Amazon SageMaker Automatic Model Tuning

AWS Machine Learning Blog

Since March 2014, Best Egg has delivered $22 billion in consumer personal loans with strong credit performance, welcomed almost 637,000 members to the recently launched Best Egg Financial Health platform, and empowered over 180,000 cardmembers who carry the new Best Egg Credit Card in their wallet.

ML 102
article thumbnail

Analyzing the history of Tableau innovation

Tableau

In this blog post, I'll describe my analysis of Tableau's history to drive analytics innovation—in particular, I've identified six key innovation vectors through reflecting on the top innovations across Tableau releases. And with this work, I invite discussions about this history, my analysis, and the implications for the future of analytics.

Tableau 145
article thumbnail

Analyzing the history of Tableau innovation

Tableau

In this blog post, I'll describe my analysis of Tableau's history to drive analytics innovation—in particular, I've identified six key innovation vectors through reflecting on the top innovations across Tableau releases. And with this work, I invite discussions about this history, my analysis, and the implications for the future of analytics.

Tableau 98
article thumbnail

How to choose a graph database: we compare 6 favorites

Cambridge Intelligence

In our experience, graph databases make most sense if you’re running complex analytical or pathfinding queries with 4 or more traversals – that is, 4+ node ‘hops’ from your starting point – or simpler graph queries that require real-time processing. Transactional, analytical, or both…?