Remove 2012 Remove Data Visualization Remove SQL
article thumbnail

Prepare training and validation dataset for facies classification using Snowflake integration and train using Amazon SageMaker Canvas

AWS Machine Learning Blog

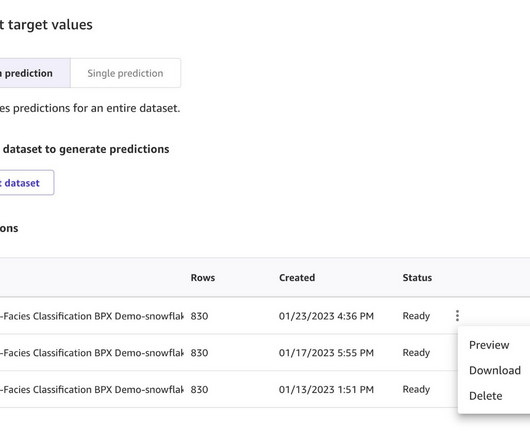
If you’re happy with the data, you can edit the custom SQL in the data visualizer. Choose Edit in SQL. Run the following SQL command before importing into Canvas. On the Trust relationship tab, choose Edit trust relationship. Choose the TRAINING_DATA table, then choose Preview dataset.

ML 102
article thumbnail

How to choose a graph database: we compare 6 favorites

Cambridge Intelligence

That’s why our data visualization SDKs are database agnostic: so you’re free to choose the right stack for your application. Many of our customers successfully build fast and scalable graph visualization applications without a graph database. With data stored as a graph, it makes sense to query it as a graph too.

professionals

Sign Up for our Newsletter

This site is protected by reCAPTCHA and the Google Privacy Policy and Terms of Service apply.

article thumbnail

Data Scientist Salary in India’s Top Tech Cities

Pickl AI

With more than 650% growth since 2012, Data Science has emerged as one of the most sought-after technologies. With the new developments in this domain, Data Science presents a picture of futuristic technology. A Data Scientist’s average salary in India is up to₹ 8.0

article thumbnail

Data scientist

Dataconomy

Analyzing data trends: Using analytic tools to identify significant patterns and insights for business improvement. Data visualization: Creating dashboards and visual reports to clearly communicate findings to stakeholders.