Remove 2012 Remove Data Preparation Remove Data Visualization
article thumbnail

Data scientist

Dataconomy

Analyzing data trends: Using analytic tools to identify significant patterns and insights for business improvement. Data visualization: Creating dashboards and visual reports to clearly communicate findings to stakeholders. Data analytics: Identifying trends and patterns to improve business performance.

article thumbnail

Best practices for Meta Llama 3.2 multimodal fine-tuning on Amazon Bedrock

AWS Machine Learning Blog

It requires sophisticated visual reasoning to interpret data visualizations and answer numerical and analytical questions about the presented information. Best practices for data preparation The quality and structure of your training data fundamentally determine the success of fine-tuning.

AWS 85
professionals

Sign Up for our Newsletter

This site is protected by reCAPTCHA and the Google Privacy Policy and Terms of Service apply.

article thumbnail

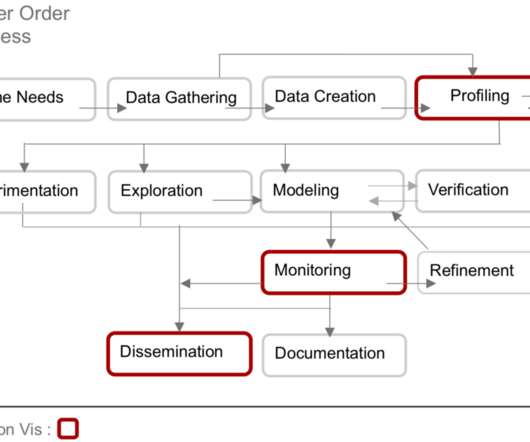
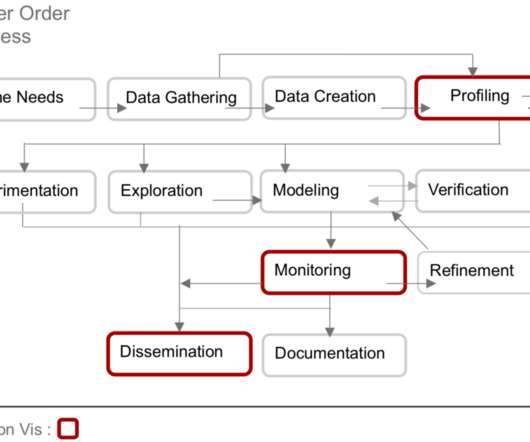
Reflecting on a decade of data science and the future of visualization tools

Tableau

In this blog post, I summarize several of the key takeaways from this research paper and share my thoughts on how its findings can help us build the next generation of data visualization tools for data science. . What is data science? It turns out data science is different things to different people.