This site uses cookies to improve your experience. To help us insure we adhere to various privacy regulations, please select your country/region of residence. If you do not select a country, we will assume you are from the United States. Select your Cookie Settings or view our Privacy Policy and Terms of Use.
Cookie Settings
Cookies and similar technologies are used on this website for proper function of the website, for tracking performance analytics and for marketing purposes. We and some of our third-party providers may use cookie data for various purposes. Please review the cookie settings below and choose your preference.
Used for the proper function of the website
Used for monitoring website traffic and interactions
Cookie Settings
Cookies and similar technologies are used on this website for proper function of the website, for tracking performance analytics and for marketing purposes. We and some of our third-party providers may use cookie data for various purposes. Please review the cookie settings below and choose your preference.
Strictly Necessary: Used for the proper function of the website
Performance/Analytics: Used for monitoring website traffic and interactions
My methods of using GPT-4 to optimize my datavisual workflow For the past 6 months, I have been a heavy daily GPT-4 user. I know it makes me sound like an addict, but I have found many good reasons and many excellent use cases where this tool is an invaluable resource for improving my data workflow.
Data scientists play a crucial role in today’s data-driven world, where extracting meaningful insights from vast amounts of information is key to organizational success. Their work blends statistical analysis, machinelearning, and domain expertise to guide strategic decisions across various industries.
t-SNE (t-distributed stochastic neighbor embedding) has become an essential tool in the realm of data analytics, standing out for its ability to unravel the complexities inherent in high-dimensional data. t-SNE was developed by Laurens van der Maaten and Geoffrey Hinton in 2008 to visualize high-dimensional data.
Hey, guys in this blog we will see some of the Best End to End MachineLearning Projects with source codes. This is going to be an interesting blog, so without any further due, let’s start… Machinelearning has revolutionized various industries, from healthcare to finance and everything in between.
Hey guys, we will see some of the Best and Unique MachineLearning Projects with Source Codes in today’s blog. If you are interested in exploring machinelearning and want to dive into practical implementation, working on machinelearning projects with source code is an excellent way to start.
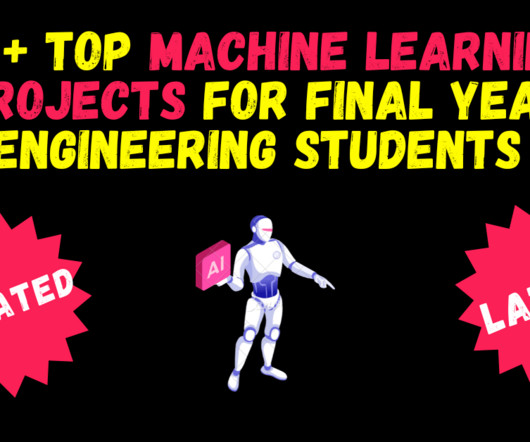
Hey guys, we will see some of the Best and Unique MachineLearning Projects for final year engineering students in today’s blog. Machinelearning has become a transformative technology across various fields, revolutionizing complex problem-solving. final year Machinelearning project.
Four reference lines on the x-axis indicate key events in Tableau’s almost two-decade history: The first Tableau Conference in 2008. The first Tableau customer conference was in 2008. Tableau had its IPO at the NYSE with the ticker DATA in 2013. Visual encoding, in particular, tapped the power of the human visual system.
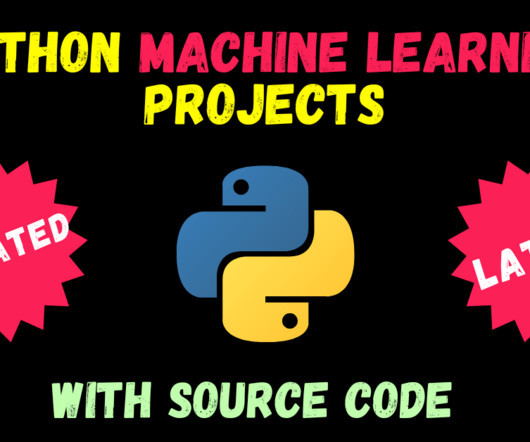
In today’s blog, we will see some very interesting Python MachineLearning projects with source code. This list will consist of Machinelearning projects, Deep Learning Projects, Computer Vision Projects , and all other types of interesting projects with source codes also provided.
I’m a PhD student of the MachineLearning Group in the University of Waikato, Hamilton, New Zealand. My PhD research focuses on meta-learning and the full model selection problem. In 2009 and 2010, I participated the UCSD/FICO data mining contests. I’m also a part-time software developer for 11ants analytics.
The GPI contains a numerical value indicating the relative peacefulness of 163 countries over a 15 year period (2008–2022). This dataset can be downloaded from the website visionofhumanity.org. This allows users to see how peace levels in different countries have evolved over time.
Four reference lines on the x-axis indicate key events in Tableau’s almost two-decade history: The first Tableau Conference in 2008. The first Tableau customer conference was in 2008. Tableau had its IPO at the NYSE with the ticker DATA in 2013. Visual encoding, in particular, tapped the power of the human visual system.
In 12 years raylib has greatly went beyond education to many other fields and today its being used for videogames development, tools development, datavisualization, graphics programming, academic research, embedded devices and, in general, for low-level graphics output in any kind of display.
Before we dig deeper into this topic and understand some of the key data facts, it is important to know that the technology is a broader spectrum, there are several other technologies that fall under its umbrella. It includes AI, Deep Learning, MachineLearning and more.
For example, instead of writing complex SQL queries, an analyst could simply ask, “How many female patients have been admitted to a hospital in 2008?” This dataset is commonly used for research and development purposes, because it provides a realistic representation of healthcare data without compromising patient privacy.
A dynamic runtime on top of the eBPF virtual machine / SQL workbench that lets you create real time visualizations of system performance data. reply wtf242 18 hours ago | prev | next [–] Still working on my books site https://thegreatestbooks.org that I started in 2008. candidates resume.
We organize all of the trending information in your field so you don't have to. Join 17,000+ users and stay up to date on the latest articles your peers are reading.
You know about us, now we want to get to know you!
Let's personalize your content
Let's get even more personalized
We recognize your account from another site in our network, please click 'Send Email' below to continue with verifying your account and setting a password.


Let's personalize your content