Remove weather maps
article thumbnail

Mapping the weather disasters of 2021

FlowingData

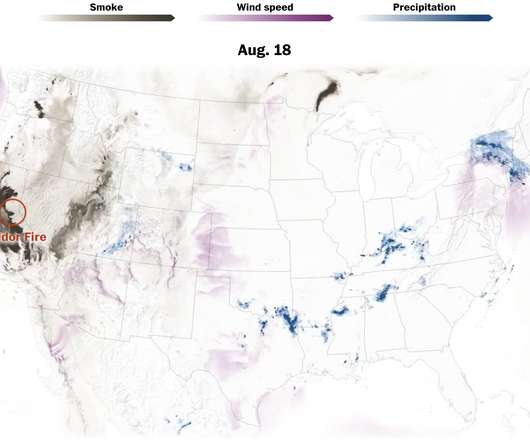
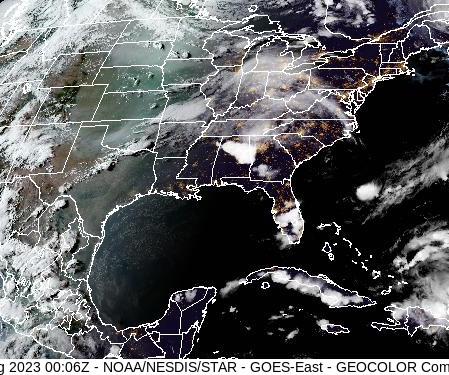
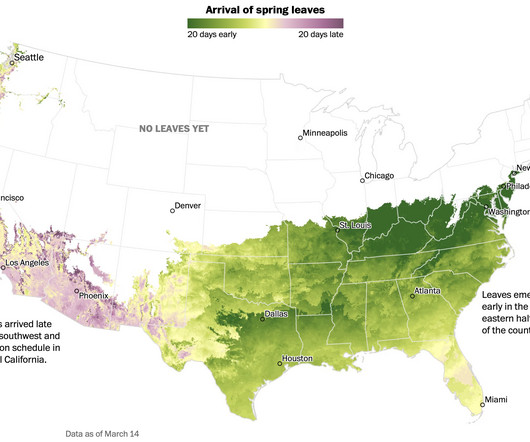
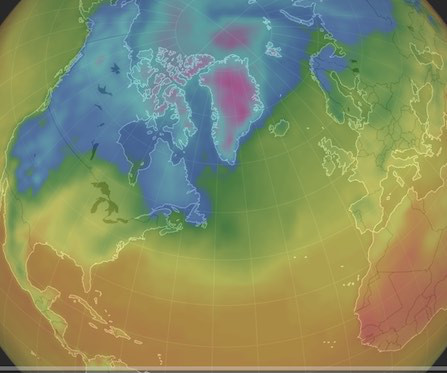
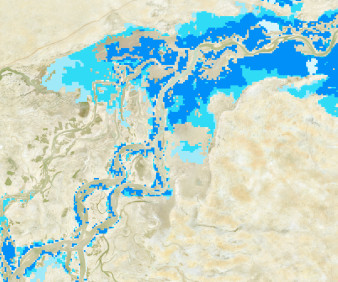
Zach Levitt and Bonnie Berkowitz for The Washington Post mapped and animated the natural and weather disasters from 2021. Differing from the 2019 version by Tim Meko, they framed it by month, which let them start with floods in January, through the storms in March, April, and May, to fires in July, up to the tornadoes in December.

94
article thumbnail

Weather Planning for Eclipse Day

Hacker News

Eclipsophile.com presents climate studies of cloud cover and weather along the tracks of upcoming solar eclipses in order to help select viewing locations and travel destinations. Cloud-cover maps and weather statistics are also available for popular aurora-observing sites globally.

155
155
professionals

Sign Up for our Newsletter

This site is protected by reCAPTCHA and the Google Privacy Policy and Terms of Service apply.

article thumbnail

See 'horned' comet 12P/Pons-Brooks in the night sky

Hacker News

All you'll need to see comet 12P/Pons-Brooks this month, besides fair weather and a little luck, are good binoculars or a telescope and sky map to help guide you.

181
181
article thumbnail

When spring is coming where you live

FlowingData

Going off the calendar, today is the first day of spring, but nature just goes off the weather. For The Washington Post, Harry Stevens mapped the early and late arrival of spring leaves across the country : This year’s winter weather pattern cleaved the country in half. Tags: spring , Washington Post , weather

110
110
article thumbnail

Field Boundaries Detection and Land Cover Classification And How EOSDA Does It

Data Science Dojo

However, land use classification requires maps of field boundaries, potentially covering large areas containing thousands of farms. It takes work to obtain such a map. This process, often referred to as supervised classification, has greatly improved the speed and accuracy of large-scale land cover mapping.

Algorithm 370
article thumbnail

Victoria power outages leave citizens in the dark

Dataconomy

It’s suspected that at least two transmission towers collapsed from extreme weather conditions. CITIPOWER has provided a map showcasing the recent Victoria power outages and at the time of writing, there are over 20 cases. Wholesale power prices spiked dramatically throughout the afternoon.

103
103
article thumbnail

Windy.com: global weather website with live filters

Hacker News

Wind map and weather forecast

144
144