Remove topics visualization
article thumbnail

10 Essential LLMs Topics to Know, LLMOps and MLOps, and Trending Open-Source Data Visualization…

ODSC - Open Data Science

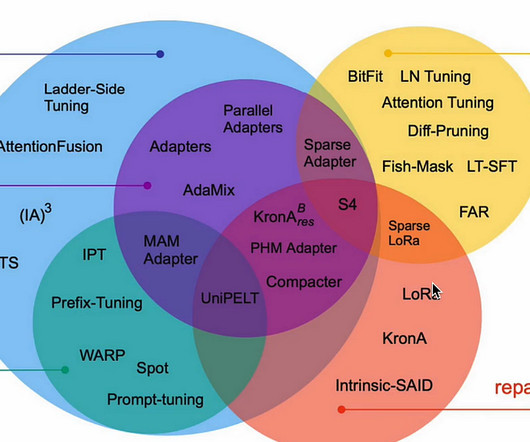
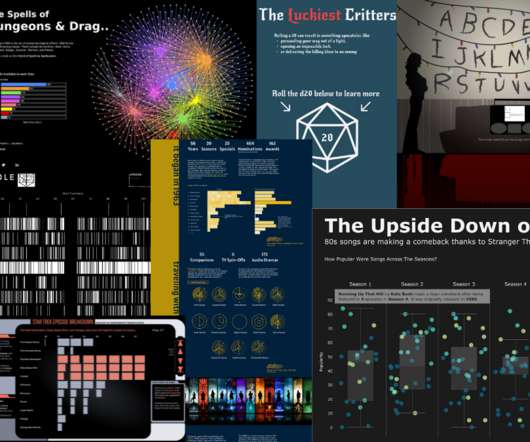
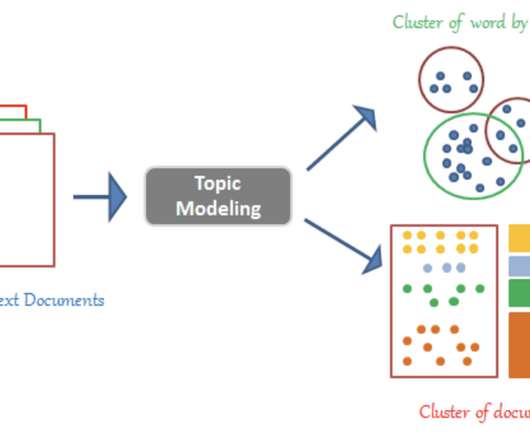
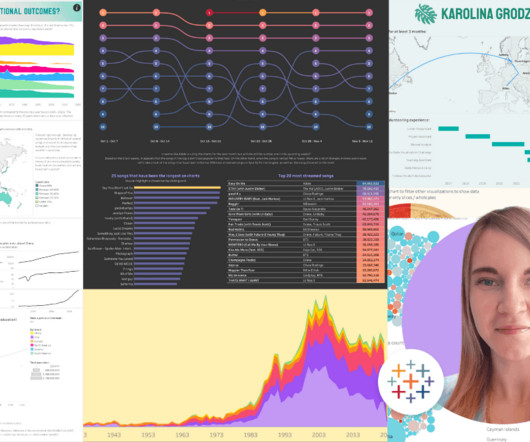
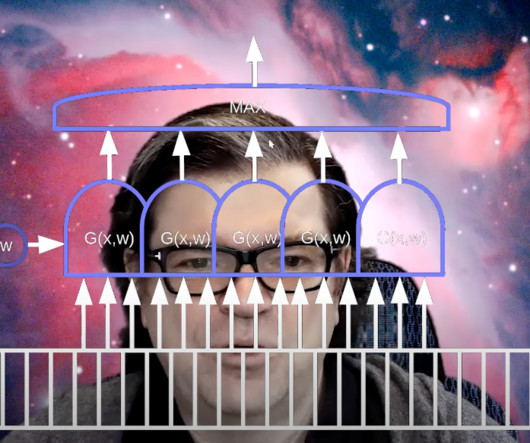
10 Essential LLMs Topics to Know, LLMOps and MLOps, and Trending Open-Source Data Visualization Tools 10 Essential Topics to Master LLMs and Generative AI In this blog, we’ll explore ten key aspects of building generative AI applications, including large language model basics, fine-tuning, and core NLP competencies.

article thumbnail

10 Important Questions for Cracking a Data Science Interview

Analytics Vidhya

Introduction You may be asked questions on various topics in a data science interview. These include statistics, machine learning, probability, data visualization, data analysis, and behavioral questions. This article was published as a part of the Data Science Blogathon.

professionals

Sign Up for our Newsletter

This site is protected by reCAPTCHA and the Google Privacy Policy and Terms of Service apply.

article thumbnail

Vision Language Models: Introducing the new tiny VLM Moondream 2

Data Science Dojo

While language models in generative AI focus on textual data, vision language models (VLMs) bridge the gap between textual and visual data. Understanding vision language models VLMs combine computer vision (CV) and natural language processing (NLP), enabling them to understand and connect visual information with textual data.

article thumbnail

The 6 best ChatGPT plugins for data science 

Data Science Dojo

This means that ChatGPT can now perform complex computations, access real-time data, and generate visualizations, all from within ChatGPT. ChatGPT can also use Wolfram Language to create more complex visualizations, such as interactive charts and 3D models. Source: Stephen Wolfram Writings Read this blog to Master ChatGPT cheatsheet 2.

article thumbnail

An Introduction to Tableau on Making Raw Data Useful

Analytics Vidhya

Introduction With this Tableau tutorial, you’ll learn how to visualize data and derive valuable insights from raw data, making dashboards, reports, tables, and more. We will also go through topics like Tableau’s desktop, server, and the various component of Tableau. Tableau is a […].

Tableau 333
article thumbnail

Meet the winners of the Pale Blue Dot challenge

DrivenData Labs

In this challenge, participants created visualizations using Earth observation data that advance the Sustainable Development Goals of zero hunger, clean water, and climate action. The Pale Blue Dot: Visualization Challenge was designed enable a broader, more diverse audience to engage with Earth observation data.

Power BI 264
article thumbnail

Discover the power of Python for data science with Data Science Dojo

Data Science Dojo

This instructor-led live training course is designed for individuals who want to learn how to use Python to perform data analysis, visualization, and manipulation. In this course, you will learn the basics of Python programming and how to use it for data analysis and visualization.