Remove tag survey
article thumbnail

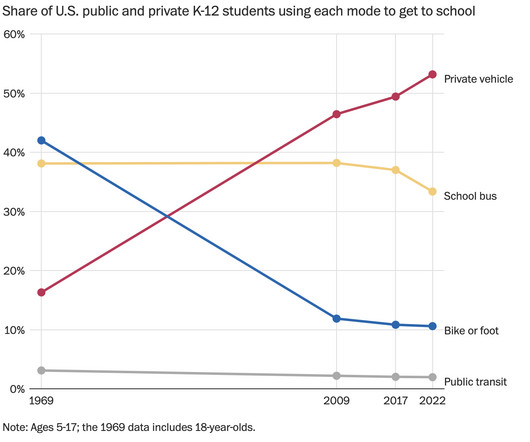
Decline of the school bus

FlowingData

The estimates are based on responses to the National Household Travel Survey conducted by the Federal Highway Administration. Tags: kids , school bus , Washington Post I rode the bus when I was a kid, until I switched to riding my bicycle. I am now a parent who drives my kids to school. So this data strikes the a chord.

138
138
article thumbnail

Consumer confidence in current economic conditions

FlowingData

For NYT Opinion, Nate Silver compares consumer confidence between two surveys. The University of Michigan’s Index of Consumer Sentiment focuses more on personal spending, whereas the Conference Board’s Consumer Confidence Survey. Tags: confidence , inflation , Nate Silver , New York Times , spending

89
professionals

Sign Up for our Newsletter

This site is protected by reCAPTCHA and the Google Privacy Policy and Terms of Service apply.

article thumbnail

Attitudes towards tipping in the U.S.

FlowingData

Pew Research surveyed 12,000 U.S. Tags: Pew Research , tipping On the one hand, customers want to support workers, but on the other, tip suggestions seem to be rising towards uncomfortable rates and in places where people don’t usually tip. adults to see how we’re all feeling about the current state of tipping.

111
111
article thumbnail

Researchers might have found Amelia Earhart’s crashed plane

FlowingData

The discovery was made possible by a high-tech unmanned underwater drone and a 16-member crew, which surveyed more than 5,200 square miles of ocean floor between September and December. Tags: airplane , Amelia Earhart , NPR , ocean

93
article thumbnail

How to Package and Price Embedded Analytics

Just by embedding analytics, application owners can charge 24% more for their product. How much value could you add? This framework explains how application enhancements can extend your product offerings. Brought to you by Logi Analytics.

article thumbnail

Data on net worth, income, and savings

FlowingData

Data for the 2022 Survey of Consumer Finances , from the Federal Reserve Board, was made available recently. Tags: Federal Reserve , income It comes out every three years, so you can see how income and savings have changed over time, broken down by demographics.

110
110
article thumbnail

When Americans Are Happiest

FlowingData

In the same survey, people were also asked about their happiness throughout the day when they ate, traveled, watched television, took care of kids, and other activities. The data comes from the well-being module of the 2021 American Time Use Survey. Tags: happiness , time use , well-being. I downloaded microdata via IPUMS.

140
140