Remove tag play
article thumbnail

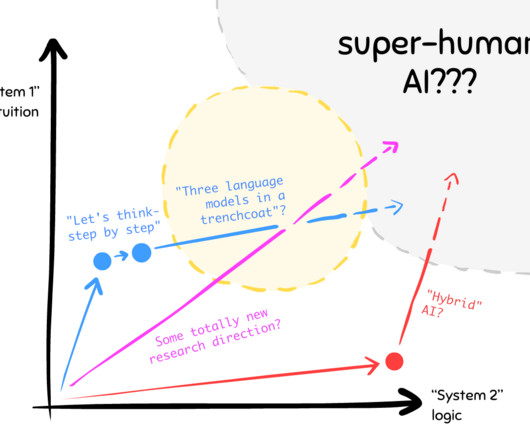
Readable and informative AI safety guide

FlowingData

While the current tools are fun to play with, there are and will be real safety challenges as the systems slurp up more data and process faster. Tags: AI , ethics , Hack Club , Nicky Case It grows more likely that the systems will directly affect your day-to-day life.

AI 93
article thumbnail

Music theory in interactive visuals

FlowingData

Tags: music , piano , theory is a set of visual tools to help you learn music theory. Learn about notes, chords, and scales through a playful and colorful interface.

94
professionals

Sign Up for our Newsletter

This site is protected by reCAPTCHA and the Google Privacy Policy and Terms of Service apply.

article thumbnail

Animated map shows the search for the best path

FlowingData

Click the map for an origin and destination, and then watch it play out. Tags: algorithm , Jan Pánek , Path When you look up directions with a mapping application, there are algorithms that run to find the shortest route. Jan Pánek made an interactive map that animates the search with various algorithms.

article thumbnail

Clock plays a song with the current time in its title

FlowingData

For The Pudding, Russell Samora pulled songs via the Spotify API and made a unique kind of clock : Every minute, random songs are played that contain the time in the title (e.g., Tags: clock , Pudding , Russell Samora , song 6:47 or 6:47 from Central Station).

99
article thumbnail

Wimbledon grass patterns

FlowingData

It has to stay short so that tennis balls maintain speed and bounce and strong enough to hold up to professional tennis play. Levine illustrate the differences between court surfaces and how grass impacts play. Tags: grass , Reuters , tennis , Wimbledon For Reuters, Travis Hartman and Ally J.

85
article thumbnail

Gerrymandering detection with simulations

FlowingData

In the interactive, you play the role of concerned citizen with the task of proposing a map that more closely resembles the political leanings of the state as a whole. Tags: gerrymandering , simulation , Washington Post.

105
105
article thumbnail

Climate spiral to show temperature change

FlowingData

Say what you will about circular visualization, but the spiral plays. Tags: Ed Hawkins , NASA , temperature. This one from NASA shows global temperature change over time : The visualization presents monthly global temperature anomalies between the years 1880-2021. The data file used to create this visualization can be accessed here.

145
145