Remove tag open-data
article thumbnail

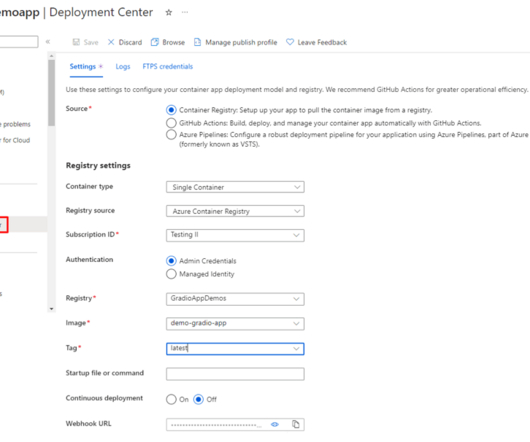
Creating a web app for Gradio application on Azure using Docker: A step-by-step guide

Data Science Dojo

Blocks provides features like multiple data flows and demos, control over where components appear on the page, handling complex data flows, and the ability to update properties and visibility of components based on user interaction. Step 5: Launch Docker Desktop to start Docker. STEP 5: Launch Docker Desktop to start Docker.

Azure 370
article thumbnail

Mapping NBA basketball shots

FlowingData

Alasdair Rae outlines the basics of visualizing basketball shot data with QGIS , an open-source software package typically used for geographic maps. Even if you’re not into basketball, sports data can be fun to poke at because it’s comprehensive and usually covers a good range of time and categories.

119
119
professionals

Sign Up for our Newsletter

This site is protected by reCAPTCHA and the Google Privacy Policy and Terms of Service apply.

article thumbnail

Mastering Facebook scraping with Python: Tips, tricks, and tools you need to know

Data Science Dojo

are used widely by billions of people. These websites have a lot of data that can be used for sentiment analysis against any incident, election prediction, result prediction of any big event, etc. If you have this data, you can analyze the risk of any decision. One empty list and an object to store data.

Python 195
article thumbnail

Handle Long Pause Between Bot Responses Using Dialogflow

Chatbots Life

In a conversational AI-enabled voice bot, in case of obtaining data from a database or requesting information from LLM models like ChatGPT, Claude, Gemini, or LLaMA, there’s inevitably a delay while waiting for updates or responses, often leading to an awkward pause in the interaction. Most importantly, enable ‘Return partial response’.

article thumbnail

Fonts for rendering lines and bars from data

FlowingData

Google Fonts now provides two open source fonts by Dmitry Ivanov that let you make simplified, small to medium line and bar charts based on data: Linefont and Wavefont. Tags: Dmitry Ivanov , font , Google These might come in handy when you want to embed small charts in body text.

110
110
article thumbnail

Mastering Docker for data science: Streamline development and share projects easily

Data Science Dojo

Are you a data scientist looking to streamline your development process and ensure consistent results across different environments? Need information on Docker for Data Science? py) that contains your data science code. But that is not all! Let us embark on this containerization journey together!

article thumbnail

Introduction to Data Science, an open source book

FlowingData

Introduction to Data Science , by Harvard biostatistics professor Rafael A. Irizarry, is an open source book that provides, as you might have guessed, an introduction to data science: The demand for skilled data science practitioners in industry, academia, and government is rapidly growing.