How to use deep learning for automated color tagging of products? (2022)
Hacker News
APRIL 9, 2024
How to automate your system using deep learning computer vision models

 tag how-to
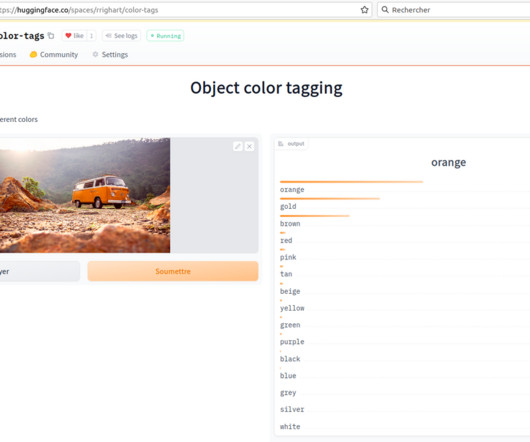
Hacker News
APRIL 9, 2024
How to automate your system using deep learning computer vision models
Data Science Dojo
FEBRUARY 22, 2023
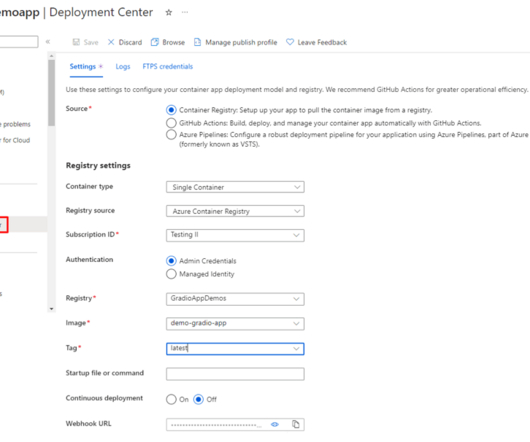
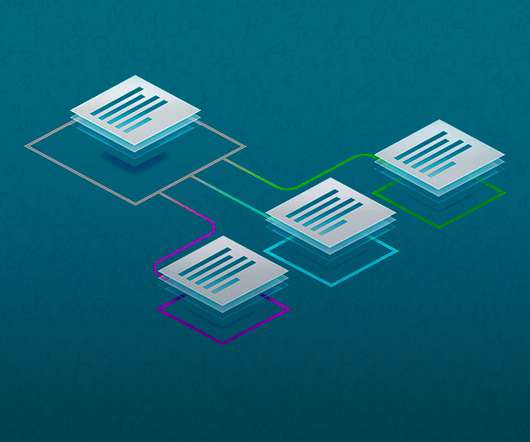
In this step-by-step guide, learn how to deploy a web app for Gradio on Azure with Docker. This blog covers everything from Azure Container Registry to Azure Web Apps, with a step-by-step tutorial for beginners. This allows the application to be packaged and pushed to the Azure Container Registry, where it can be stored until needed.
This site is protected by reCAPTCHA and the Google Privacy Policy and Terms of Service apply.

Hacker News
MARCH 18, 2024
I’ll show how this vulnerability can be exploited even when Memory Tagging Extension (MTE), a powerful mitigation, is enabled on the device. In this post, I’ll look at CVE-2023-6241, a vulnerability in the Arm Mali GPU that allows a malicious app to gain arbitrary kernel code execution and root on an Android phone.
Analytics Vidhya
JULY 28, 2020
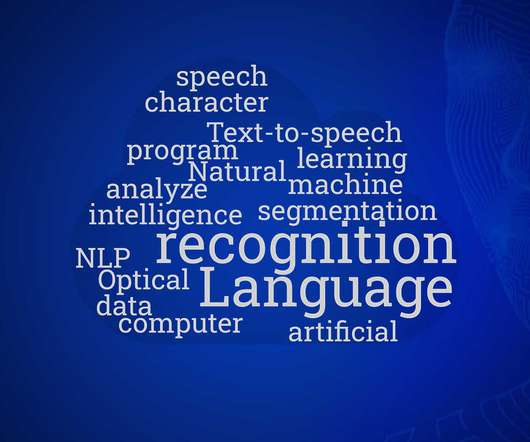
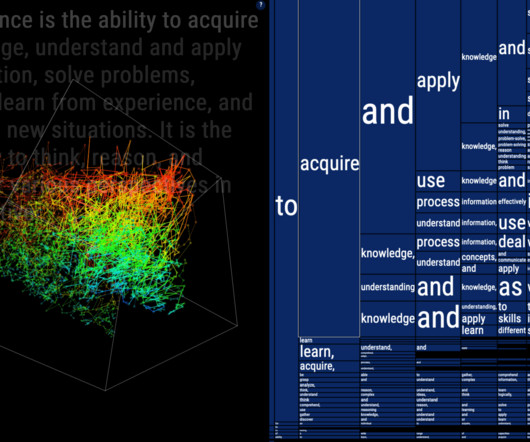
Overview Learn about Part-of-Speech (POS) Tagging, Understand Dependency Parsing and Constituency Parsing Introduction Knowledge of languages is the doorway to wisdom. . The post How Part-of-Speech Tag, Dependency and Constituency Parsing Aid In Understanding Text Data? appeared first on Analytics Vidhya.
Advertisement
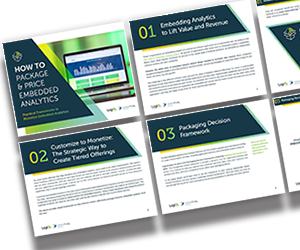
How much value could you add? This framework explains how application enhancements can extend your product offerings. Just by embedding analytics, application owners can charge 24% more for their product. Brought to you by Logi Analytics.
FlowingData
MAY 30, 2024
We talked about the new book and more generally, how data visualization changed over the past couple decades. Tags: Jon Schwabish , podcast , PolicyViz You also get to hear me realize in real-time that I had not talked about these things out loud in a long while. I mean it’s great and you should definitely listen.

KDnuggets
NOVEMBER 8, 2021
Learn about the strengths of part-of-speech tagging, and about how a strong POS tagger can contribute to natural language understanding.

Expert insights. Personalized for you.


Let's personalize your content