Remove tag extremism
article thumbnail

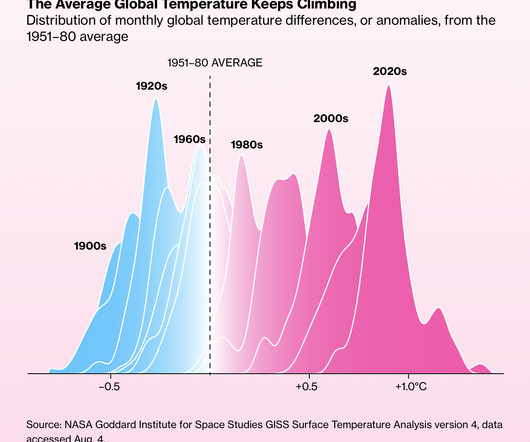
A hotter year, again

FlowingData

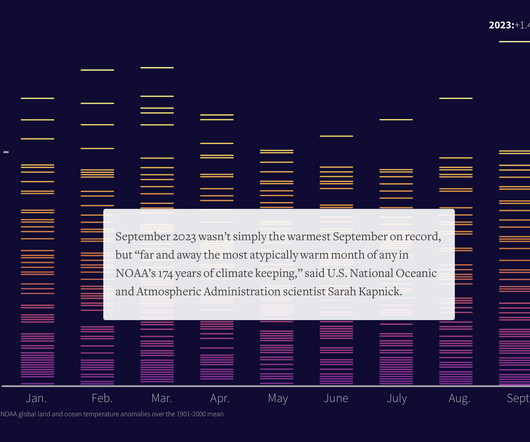
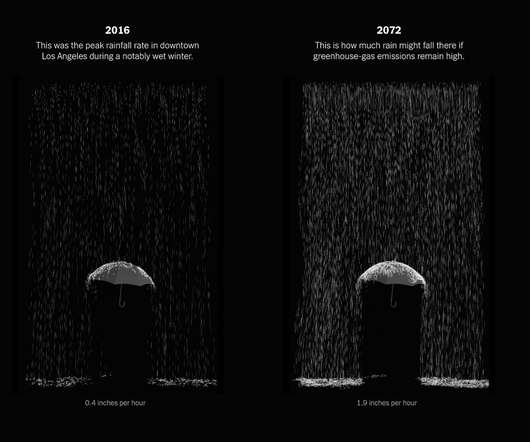
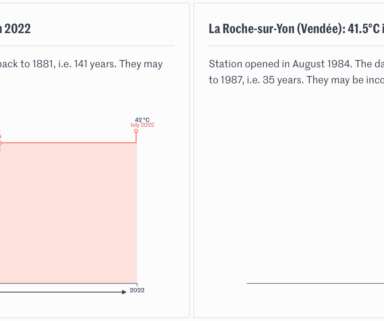
Extremes became more extreme. It’s boosting the warming caused by climate change, unleashing more catastrophic extremes. Temperature extremes are still worth highlighting, but there are only so many ways to show an increase over and over again. Tags: climate , global warming , Reuters , temperature

102
102
article thumbnail

Mona Chalabi wins Pulitzer for data illustrations

FlowingData

Mona Chalabi, known around these parts for her illustrative approach to data journalism, was awarded a Pulitzer Prize for her New York Times piece on Jeff Bezos’ extreme wealth. Tags: illustration , Mona Chalabi , New York Times , Pulitzer Congratulations to Mona.

106
106
professionals

Sign Up for our Newsletter

This site is protected by reCAPTCHA and the Google Privacy Policy and Terms of Service apply.

article thumbnail

Mapping extreme heat

FlowingData

For Bloomberg, Marie Patino reports on the shifting design choices for mapping weather extremes. Tags: Bloomberg , climate , color , heat. The rainbow color scheme and sunny icons aren’t cutting it anymore.

103
103
article thumbnail

Drought in the Western United States

FlowingData

In what’s become a recurring theme almost every year, the western United States is experiencing drought, much of it exceptional or extreme. Tags: climate change , drought , Nadja Popovich , New York Times. Nadja Popovich for The New York Times has the small multiple maps to show June conditions each year since 2000.

123
123
article thumbnail

Shifting towards more hot days, fewer cold days

FlowingData

For Bloomberg, Zahra Hirji, Rachael Dottle and Denise Lu lean into layered density plots to show the shift and the path towards extreme climates. Tags: Bloomberg , global warming They show distributions, which can be a challenge for non-data people to understand.

75
article thumbnail

Megaflood scenario

FlowingData

Swain, who studied “plausible worst case scenario” extreme storm sequences, The New York Times provides a glimpse of what that might look like in California. Tags: California , climate , New York Times , rain , storm. Highlighting research by Xingying Huang and Daniel L.

84
article thumbnail

Visual guide for protecting your home from wildfire

FlowingData

Can’t wait for the guides on how to protect your home from flooding and/or how to dress for extreme temperatures. Tags: 3-d , Washington Post , wildfire. It starts with an ember floating carefree in the air, and then the tour highlights actions you can take.

96