This site uses cookies to improve your experience. To help us insure we adhere to various privacy regulations, please select your country/region of residence. If you do not select a country, we will assume you are from the United States. Select your Cookie Settings or view our Privacy Policy and Terms of Use.
Cookie Settings
Cookies and similar technologies are used on this website for proper function of the website, for tracking performance analytics and for marketing purposes. We and some of our third-party providers may use cookie data for various purposes. Please review the cookie settings below and choose your preference.
Used for the proper function of the website
Used for monitoring website traffic and interactions
Cookie Settings
Cookies and similar technologies are used on this website for proper function of the website, for tracking performance analytics and for marketing purposes. We and some of our third-party providers may use cookie data for various purposes. Please review the cookie settings below and choose your preference.
Strictly Necessary: Used for the proper function of the website
Performance/Analytics: Used for monitoring website traffic and interactions
. # Step 1: Preparing and Exporting Excel Spreadsheets Lets consider a quarterly business report with data on sales, expenses, profit, and customer satisfaction scores across different regions and product categories. What product showed the greatest profitability increase? Therefore, the average customer satisfaction score is 86.25% ".
product_names = [item[name] for item in products] This list comprehension iterates through each dictionary in the products list and extracts the name field. This one-liner efficiently plucks specific values from nested structures, making it perfect for creating summary lists or preparing data for further analysis.
In this comprehensive guide, we’ll explore the technical foundations, architectures, use cases, and best practices of graph rag versus traditional RAG, helping you understand which approach is best for your enterprise AI, research, or product development needs. Scientific Research: Discovering connections between genes, diseases, and drugs.
Learn more about our Publications Learn more Publications Resources We make products, tools, and datasets available to everyone with the goal of building a more collaborative ecosystem. Heres a simplified breakdown of how MUVERA works: FDE generation : MUVERA employs mappings to convert query and document multi-vector sets into FDEs.
We know we want to create products which our customers find to be valuable. Whether we label it as customer-centric or product-led depends on how long we've been doing product management. Attendance of this webinar will earn one PDH toward your NPDP certification for the Product Development and Management Association.
Orchestrating parallel tasks using the map functionality Arrays are fundamental data structures in programming, consisting of ordered collections of elements. Step Functions provides two different mapping strategies for iterating through arrays: inline mapping and distributed mapping, each with its own advantages and use cases.
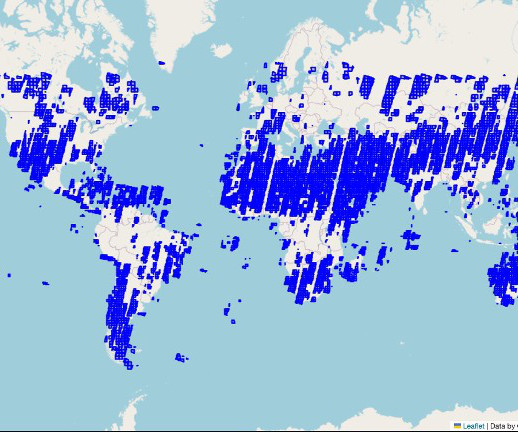
In this post, we demonstrate the power of SageMaker geospatial capabilities by mapping the world’s vegetation in under 20 minutes. For our vegetation mapping project, we’ve selected Sentinel-2 for its global coverage and update frequency. This example of vegetation mapping is just the beginning for running planetary-scale ML.
Heat maps are a fascinating way to visualize data, turning complex information into easily understandable graphics. What are heat maps? Heat maps are a powerful data visualization tool that visually represent complex datasets, making it easier to interpret and analyze information.
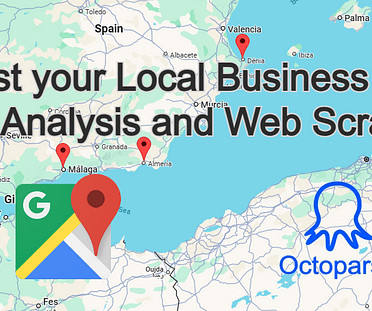
Today, we will explore how to collect, process, and analyze Google Maps data to your advantage and eventually improve your local business. We are using the Octoparse Web Scraping app for this part called Google Maps Listing and Details Page… Read the full blog for free on Medium. Lets jump right into it!
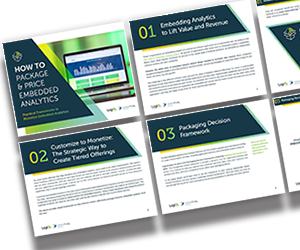
Just by embedding analytics, application owners can charge 24% more for their product. This framework explains how application enhancements can extend your product offerings. How much value could you add? Brought to you by Logi Analytics.
CRAG is like Google Maps with live traffic.It Traditional RAG is like asking a random stranger for directions and blindly following them.Corrective RAG is like cross-checking directions on Google Maps, and asking a… Read the full blog for free on Medium. If the system pulls poor-quality documents, the response will be poor too.
Hill Space: Elegant Mapping Between Worlds Hill Space—the constraint topology created by W = tanh(Ŵ) ⊙ σ(M̂) —maps any unbounded learned weights to the [-1,1] range, where stable plateaus naturally guide optimization toward discrete selections. Unbounded Input Optimizers learn any values they need: -47.2,
Today, we will explore how to collect, process, and analyze Google Maps data to your advantage and eventually improve your local business. We are using the Octoparse Web Scraping app for this part called Google Maps Listing and Details Page… Read the full blog for free on Medium. Lets jump right into it!
In ecommerce, visual search technology revolutionizes how customers find products by enabling them to search for products using images instead of text. Companies such as Amazon use this technology to allow users to use a photo or other image to search for similar products on their ecommerce websites.
Speaker: Jon Harmer, Product Manager for Google Cloud
This session will provide you with a comprehensive set of tools to help you develop impactful products by shifting from output-based thinking to outcome-based thinking. Grow your user empathy skills: Better understand users and the problem space they are working in through Journey Maps that are customized for Product Managers.
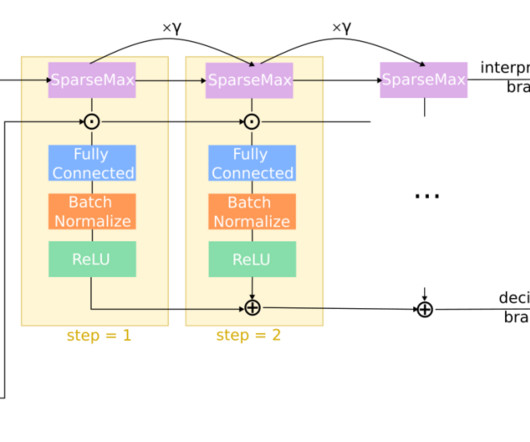
It is a sequence-to-sequence mapping that transforms each sequence element into a weighted sum of values. The weights are typically obtained as the softmax of dot products between keys and queries. *Primary Contributors Attention is a key part of the transformer architecture.
But how good it this tool now with charting data and with map images? I wrote an article on this last year: Prompting GPT-4 for CSV data from line and bar chart images pub.towardsai.net With GPT-4o, there have been some pretty big changes the big question for me is has quantitative analysis of chart and map data improved?
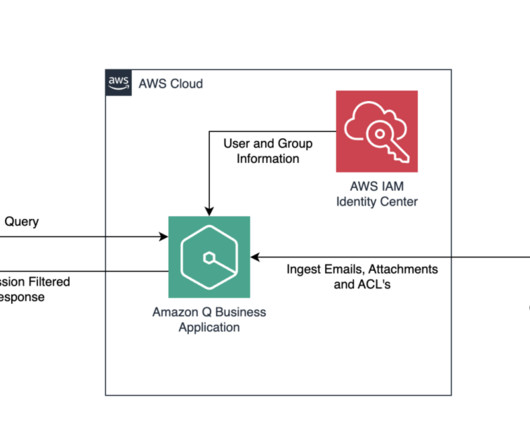
Gmail for business is part of Google Workspace , which provides a set of productivity and collaboration tools like Google Drive , Gmail , and Google Calendar. With the Gmail connector for Amazon Q Business, you can enhance productivity and streamline communication processes within your organization.
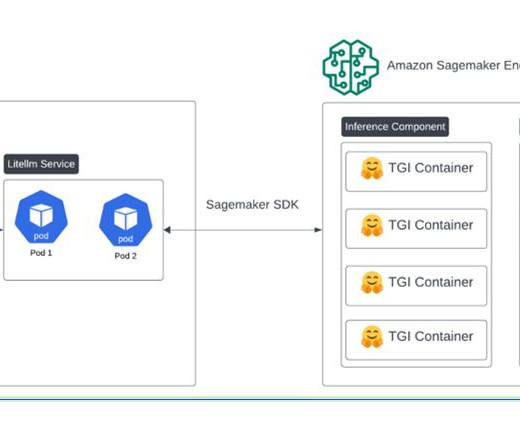
Since our founding nearly two decades ago, machine learning (ML) and artificial intelligence (AI) have been at the heart of building data-driven products that better match job seekers with the right roles and get people hired. How can we provide production LLM inference at Indeed’s scale with favorable latency and costs?
Assumptions mapping is the process of identifying and testing your riskiest ideas. Watch this webinar with Laura Klein, product manager and author of Build Better Products, to learn how to spot the unconscious assumptions which you’re basing decisions on and guidelines for validating (or invalidating) your ideas.
Events Data + AI Summit Data + AI World Tour Data Intelligence Days Event Calendar Blog and Podcasts Databricks Blog Explore news, product announcements, and more Databricks Mosaic Research Blog Discover the latest in our Gen AI research Data Brew Podcast Let’s talk data! That way, whenever the user creates a notebook/job/pipeline/etc.,
By mapping connections, semantic networks create a structured environment where information can be retrieved and utilized more effectively. Retail: Optimized inventory management and product recommendations. Knowledge management: Assisting in organizing and analyzing knowledge to boost productivity. What is a semantic network?
Events Data + AI Summit Data + AI World Tour Data Intelligence Days Event Calendar Blog and Podcasts Databricks Blog Explore news, product announcements, and more Databricks Mosaic Research Blog Discover the latest in our Gen AI research Data Brew Podcast Let’s talk data! mapping a user prompt for “UK” to “country = United Kingdom”).
July 05, 2025 From Photos to Positions: Prototyping VLM-Based Indoor Maps Disclaimer: This project was completed entirely on personal time and hardware. It was far from a working solution—we didn’t have an accurate map to align things with—but it planted a seed. Lets start simply: What features are on these maps?
Use cases we have worked on include: Technical assistance for field engineers – We built a system that aggregates information about a company’s specific products and field expertise. Ecommerce product search – We built several solutions to enhance the search capabilities on ecommerce websites to improve the shopping experience for customers.
But how good it this tool now with charting data and with map images? I wrote an article on this last year: Prompting GPT-4 for CSV data from line and bar chart images pub.towardsai.net With GPT-4o, there have been some pretty big changes the big question for me is has quantitative analysis of chart and map data improved?
By Kanwal Mehreen , KDnuggets Technical Editor & Content Specialist on June 25, 2025 in Artificial Intelligence Image by Author | Ideogram Trust me, this isn’t one of those clickbait articles with shady affiliate links or forced product placements. She co-authored the ebook "Maximizing Productivity with ChatGPT". We all know them.
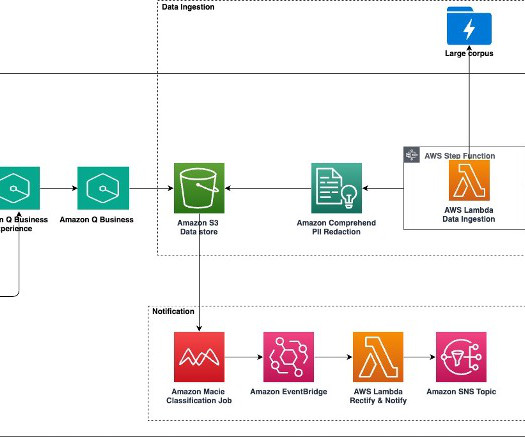
Solution overview The following architecture diagram represents the high-level design of a solution proven effective in production environments for AWS Support Engineering. The workflow includes the following steps: The Prepare Map Input Lambda function prepares the required input for the Map state.
Lookups search the underlying mappings one by one until a key is found. Combining Multiple Dictionaries with ChainMap The collections.ChainMap class provides a way to link multiple dictionaries together so they can be treated as a single unit. Its often much faster than creating a new dictionary and running multiple update() calls.
These sessions, featuring Amazon Q Business , Amazon Q Developer , Amazon Q in QuickSight , and Amazon Q Connect , span the AI/ML, DevOps and Developer Productivity, Analytics, and Business Applications topics. Learn from the AWS Product Management team about the benefits of Amazon Q Business and the latest innovations in Amazon Q Apps.
These challenges impact productivity and scalability, especially when dealing with multiple presentation recordings, conference sessions, training materials, and educational content. Amazon Bedrock processes and improves each raw transcription section through a Map state.
Customers need better accuracy to take generative AI applications into production. Graphs maintain the natural structure of the data, allowing for a more precise mapping between questions and answers. In a world where decisions are increasingly data-driven, the integrity and reliability of information are paramount.
Assuming there’s a productivity boost from using this tool, even this lofty price tag would be a bargain. Product engineering, research, and infrastructure all had to come together to create the Windsurf experience – especially Cascade.’ This feature will surely become a paid product, in the future.
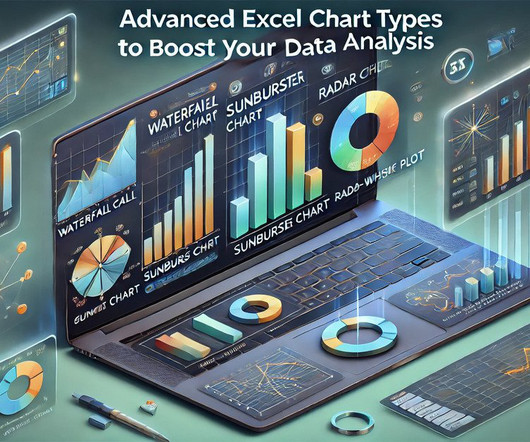
billion people use Microsoft’s Productivity Services, including Excel. Excel holds a 10.15% market share in productivity tools, highlighting its global impact. Project Progress: Mapping how different stages contribute to the completion of a project, such as phases of resource allocation or task completion.
These are running in production — often under strict compliance and governance regimes. There’s even a “developer rack” — a mini version to validate workloads before full deployment. Why this model matters: industry examples The architecture isn’t theoretical.
Once the input is tokenized, each token is mapped to a high-dimensional vector through an embedding layer. Whether you’re just getting started with AI or deploying LLMs in production, knowing how LLMs work equips you to innovate responsibly and effectively. Step 2: Embedding – How do LLMs work with tokens? Ready to dive deeper?
The high-volume, high-speed process relies on three high-resolution cameras, which analyze fiber composition at the millimeter level using a multidimensional map. Deepnest provides brand, product type, material, and region details, even showing how packaging moves through waste streams to determine whether it was sorted, recycled, or lost.
Map business objectives to data goals : For example, if the business goal is to reduce customer churn, identify the data insights needed to achieve that. ETL tools : Map how data will be extracted, transformed, and loaded. Visualize workflows : Map out data flows or process diagrams to identify gaps or inefficiencies.
The mere threat of landmine contamination in a territory not only endangers the physical well-being of affected populations but also results in a loss of forest areas, reduction of productive land , exacerbation of social vulnerability , delay of infrastructure development , and damage of natural, physical, and social capital.
By analyzing weather forecasts and real-time sensor inputs, an AI agent might determine the ideal time for planting or harvesting, reducing waste and maximizing productivity. By automating repetitive aspects of content creation, AI agents free up human creators to focus on strategy and creativity, enhancing overall productivity.
With the significant developments in the field of generative AI , intelligent applications powered by foundation models (FMs) can help users map out an itinerary through an intuitive natural conversation interface. This is where AWS and generative AI can revolutionize the way we plan and prepare for our next adventure.
By consolidating model governance workflows in SageMaker Model Registry, you can improve transparency and streamline the deployment of models to production environments upon governance officers’ approval. It’s mapped to the custom_details field. A model group contains a group of versioned models. factors_affecting_model_efficiency="No.",
The top-performing products were Product A, Product B, and Product C. The top-performing products were Product A, Product B, and Product C. million, representing a 12% growth compared to the previous quarter.
We organize all of the trending information in your field so you don't have to. Join 17,000+ users and stay up to date on the latest articles your peers are reading.
You know about us, now we want to get to know you!
Let's personalize your content
Let's get even more personalized
We recognize your account from another site in our network, please click 'Send Email' below to continue with verifying your account and setting a password.


Let's personalize your content