Remove price ordinals
article thumbnail

Previously…

Towards AI

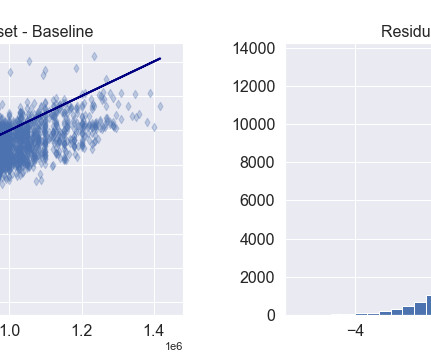
Enhancing The Robustness of Regression Model with Time-Series Analysis— Part 2 A case study on Singapore’s HDB resale prices. In the second part, we will move our focus to building regression models on how to predict Singapore’s HDB prices. Photo by Robbie Down on Unsplash Welcome to the second segment of this article!

AI 100
article thumbnail

Announcing the Winners of ‘Predicting Vegetation Health in Marsabit, Kenya’ Data Challenge

Ocean Protocol

This challenge was designed to challenge participants in making accurate, dependable forecasts that could have a profound impact on risk mitigation, insurance pricing, and crop prediction in the region. However, simply throwing raw Ordinal time-related features in the mix is unlikely to yield optimal results.

professionals

Sign Up for our Newsletter

This site is protected by reCAPTCHA and the Google Privacy Policy and Terms of Service apply.

article thumbnail

Bitcoin halving might happen in April 2024

Dataconomy

It is forecasted to double as Bitcoin prices are projected to reach unprecedented highs post-halving in April, and as Ethereum ETFs are poised for imminent approval. Similarly, the 2020 halving saw a price increase as the onset of COVID-19 prompted concerns over inflation due to expansive monetary policies.

103
103
article thumbnail

Recurrent Networks Hello World in Clojure with new Deep Diamond RNN support on CPU and GPU

Dragan Djuric

An example of data that fits this task would be temperature at some place, stock prices, and any other (possibly infinite) sequence of numbers in one of more dimensions that have an ordinal relation, that is, has an abstract notion of time attached to it.

article thumbnail

Authoring custom transformations in Amazon SageMaker Data Wrangler using NLTK and SciPy

AWS Machine Learning Blog

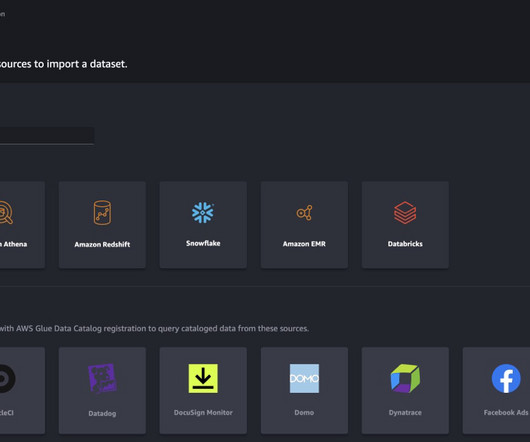
To learn more about using data flows with Data Wrangler, refer to Create and Use a Data Wrangler Flow and Amazon SageMaker Pricing. reshape(-1, 1) df["age"] = kbins.fit_transform(ages) print(kbins.bin_edges_) You can see the bin edges printed in the following screenshot.

AWS 84
article thumbnail

Build ML features at scale with Amazon SageMaker Feature Store using data from Amazon Redshift

Flipboard

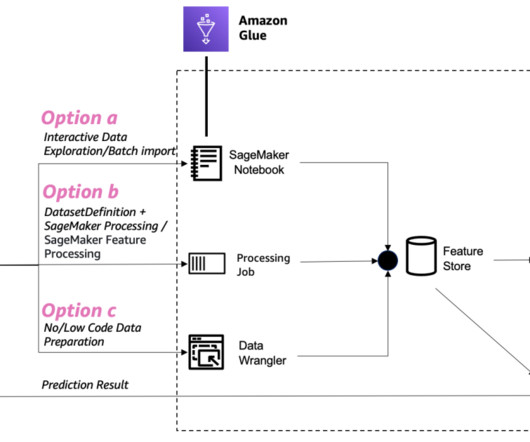
Amazon Redshift uses SQL to analyze structured and semi-structured data across data warehouses, operational databases, and data lakes, using AWS-designed hardware and ML to deliver the best price-performance at any scale. SageMaker Studio is the first fully integrated development environment (IDE) for ML.

ML 93
article thumbnail

How your customers perceive you and your products.

Mlearning.ai

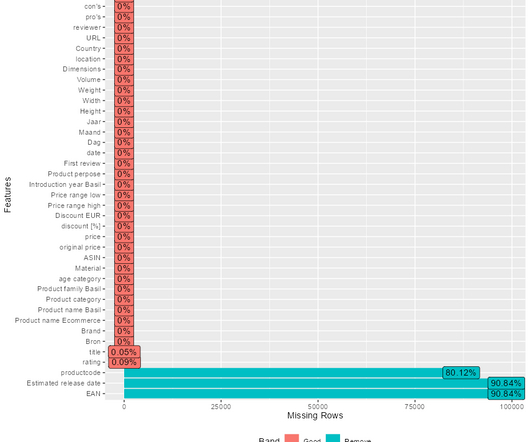
The density plot is a bit misused here, because the five-rating scores are on an ordinal level, not a ratio. So, what I did here, was focus on the words ‘price’, ‘nice’ and ‘bad’. product_category%in%("-") & brand%in%c("xxxx", "XXXX"))%>% ggplot(., And so there really is nothing inbetween.

ML 52