Remove home dashboard settings following
article thumbnail

Using IBM Turbonomic for monitoring Cloud Pak for Data

IBM Data Science in Practice

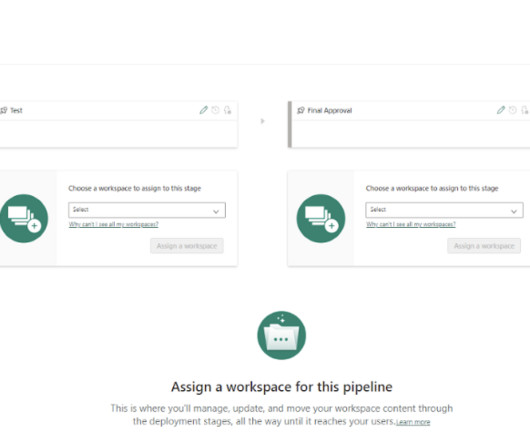
We share more details on how to use the report service and the predefined reports in Grafana dashboards. We provide report configuration details on how to set up the customized container and pod usage reports in dashboards. Click it to open a new Dashboards page. You might see a screen like the following example.

article thumbnail

Build a centralized monitoring and reporting solution for Amazon SageMaker using Amazon CloudWatch

AWS Machine Learning Blog

Amazon SageMaker is a fully managed machine learning (ML) platform that offers a comprehensive set of services that serve end-to-end ML workloads. In this post, we present a cross-account observability dashboard that provides a centralized view for monitoring SageMaker user activities and resources across multiple accounts.

AWS 77
professionals

Sign Up for our Newsletter

This site is protected by reCAPTCHA and the Google Privacy Policy and Terms of Service apply.

article thumbnail

CBRE and AWS perform natural language queries of structured data using Amazon Bedrock

AWS Machine Learning Blog

Although CBRE provides customers their curated best-in-class dashboards, CBRE wanted to provide a solution for their customers to quickly make custom queries of their data using only natural language prompts. This solution can be applied to other dashboards at a later stage.

AWS 95
article thumbnail

Extract phone call insights with LLMs in Python

AssemblyAI

Set up time for builder to assess potential property site prior to purchase. CONTACT INFORMATION: Name: Lindstrom, Kenny Phone number: 610-265-1715 Getting Started To follow along with this tutorial, you’ll need to have Python installed and an AssemblyAI API key, which you can get here.

Python 111
article thumbnail

Build a receipt and invoice processing pipeline with Amazon Textract

AWS Machine Learning Blog

Solution overview The following architecture diagram shows the stages of a receipt and invoice processing workflow. You can visualize the indexed metadata using OpenSearch Dashboards. Approved documents are also set up to be moved to Amazon S3 Intelligent-Tiering for long-term retention and archival using S3 lifecycle policies.

AWS 86
article thumbnail

Student to BI Analyst, How Tableau Can Lead to a Successful Data Career

Tableau

It was when I was bored at home during COVID lockdowns. Then, on LinkedIn, I found a workshop on building your first Tableau dashboard. When creating data visualizations to share in your portfolio look for data sets that interest you, because then it won’t feel like work when you’re vizzing. How did Karolina discover Tableau? “It

Tableau 105
article thumbnail

How to Create Power BI Deployment Pipelines

phData

In this blog, I’ll describe what Power BI Deployment Pipelines are and why they are useful, and then provide step-by-step directions on how to set them up. The orange “X” denotes that a change has occurred and that the content needs to be promoted to the following workspace to reflect the latest version.