

Building a harvest model for cucumbers
Mlearning.ai
FEBRUARY 24, 2023
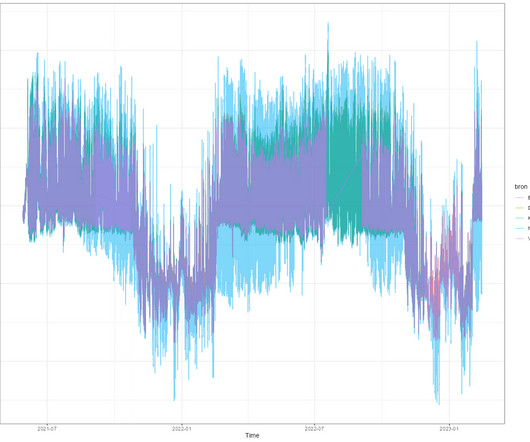
library(readr) library(readxl) library(ggplot2) theme_set(theme_bw()) library(dplyr) library(lubridate) ggplot(df_temp, aes(x=Tijd, y=Temperature, col=bron))+ geom_line(alpha=0.5)+ labs(x="Time") First plot shows all the temperature data that I have. Lets get started! This gap shows the gap between two harvests.


Let's personalize your content