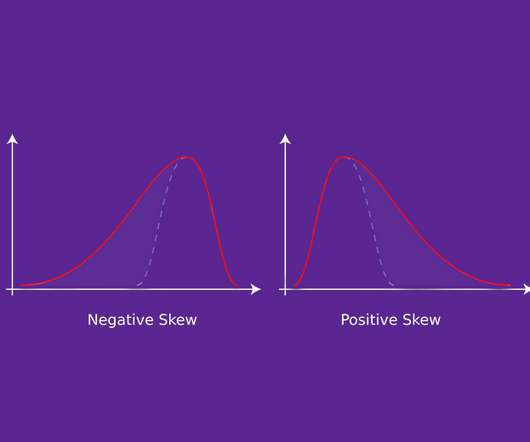
Statistics for Data Science: What is Skewness and Why is it Important?
Analytics Vidhya
JULY 5, 2020
Overview Skewness is a key statistics concept you must know in the data science and analytics fields Learn what is skewness, the formula for. The post Statistics for Data Science: What is Skewness and Why is it Important? appeared first on Analytics Vidhya.


Let's personalize your content