Sat.Jun 06, 2020 - Fri.Jun 12, 2020

article thumbnail

SQL for Beginners and Analysts – Get Started with SQL using Python

Analytics Vidhya

Overview SQL is a mandatory language every analyst and data science professional should know Learn about the basics of SQL here, including how to. The post SQL for Beginners and Analysts – Get Started with SQL using Python appeared first on Analytics Vidhya.

SQL 306
article thumbnail

Applying AI Solutions at the Startup, Growth and Enterprise Stages

Dataconomy

We see companies applying AI solutions differently, depending on their growth stage. Here are the challenges they face and the best practices at each stage. A growing number of companies are seeking to apply artificial intelligence (AI) solutions, whether they want to launch disruptive products or innovate the customer experience. The post Applying AI Solutions at the Startup, Growth and Enterprise Stages appeared first on Dataconomy.

professionals

Sign Up for our Newsletter

This site is protected by reCAPTCHA and the Google Privacy Policy and Terms of Service apply.

article thumbnail

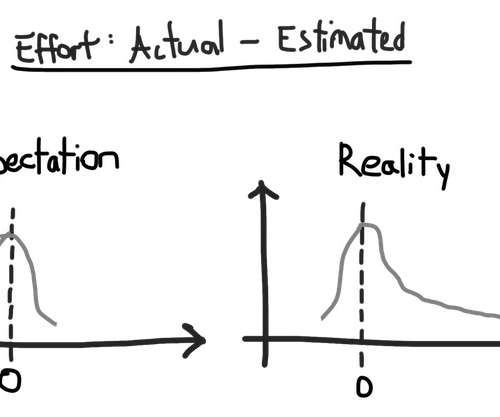
What I Love about Scrum for Data Science

Eugene Yan

Initially, I didn't like it. But over time, it grew on me. Here's why.

article thumbnail

Deliver on the Promises of the Cloud with Alation and Databricks

Alation

The post Deliver on the Promises of the Cloud with Alation and Databricks appeared first on Alation.

52
article thumbnail

Navigating the Future: Generative AI, Application Analytics, and Data

Generative AI is upending the way product developers & end-users alike are interacting with data. Despite the potential of AI, many are left with questions about the future of product development: How will AI impact my business and contribute to its success? What can product managers and developers expect in the future with the widespread adoption of AI?

article thumbnail

5 Powerful Excel Dashboards for Analytics Professionals

Analytics Vidhya

Overview Dashboards are ubiquitous in the industry. Every analyst should be well versed with how to create dashboards Excel is an excellent tool for. The post 5 Powerful Excel Dashboards for Analytics Professionals appeared first on Analytics Vidhya.

Analytics 291
article thumbnail

How heads of data can jumpstart machine learning without hiring

Dataconomy

Read on the extract of the guide “6 steps to jumpstart machine learning using the resources you already have” written by Explorium – it explains how senior data professionals can enable data science in their organizations with the resources they have available, how to use cutting-edge technology to make the. The post How heads of data can jumpstart machine learning without hiring appeared first on Dataconomy.

More Trending

article thumbnail

How to optimize page performance using heatmaps

Twilio Segment

This recipe shows you how to use heatmaps to optimize the performance of your webpages. By seeing the areas of pages that users are engaging with most often, you can determine where to invest your time and energy.

40
article thumbnail

Everything you Should Know About Data Structures in Python

Analytics Vidhya

Overview Data structures in Python are a key concept to learn before we dive into the nuances of data science and model building Learn. The post Everything you Should Know About Data Structures in Python appeared first on Analytics Vidhya.
Python 284
article thumbnail

Q1 2020: All About Software-Defined and As-a-Service

DataCentric podcast

What did we learn about datacenter infrastructure from the latest batch of earnings? That’s it all about software-defined and as-a-service. Data center hardware sales were down across the board, while the bright spots for the quarter landed on Nutanix and VMware, who showed particularly strong growth in is VSAN and NSX segments. This, while the traditional OEMs saw boosts in their respective service-based offerings.

40
article thumbnail

Introduction to ANOVA for Statistics and Data Science (with COVID-19 Case Study using Python)

Analytics Vidhya

Introduction “A fact is a simple statement that everyone believes. It’s innocent, unless found guilty. A Hypothesis is a novel suggestion that no one. The post Introduction to ANOVA for Statistics and Data Science (with COVID-19 Case Study using Python) appeared first on Analytics Vidhya.

article thumbnail

Get Better Network Graphs & Save Analysts Time

Many organizations today are unlocking the power of their data by using graph databases to feed downstream analytics, enahance visualizations, and more. Yet, when different graph nodes represent the same entity, graphs get messy. Watch this essential video with Senzing CEO Jeff Jonas on how adding entity resolution to a graph database condenses network graphs to improve analytics and save your analysts time.

article thumbnail

Your Guide to Getting Started with Geospatial Analysis using Folium (with multiple case studies)

Analytics Vidhya

Overview Geospatial analysis is taking on an ever more important role in the industry The Folium library in Python helps us analyze the location. The post Your Guide to Getting Started with Geospatial Analysis using Folium (with multiple case studies) appeared first on Analytics Vidhya.

Python 272
article thumbnail

Build your own Animated Data Visualization in Tableau in Just 5 Minutes

Analytics Vidhya

Overview Animated visualizations are a work of art and are really easy to create in Tableau We’ll work with open-source datasets here and create. The post Build your own Animated Data Visualization in Tableau in Just 5 Minutes appeared first on Analytics Vidhya.

article thumbnail

How COVID-19 is Impacting Tech Stacks [According to Our Data]

Twilio Segment

In our new data report, we take an inside look into how tech stacks have evolved since the onset of COVID-19.

40