

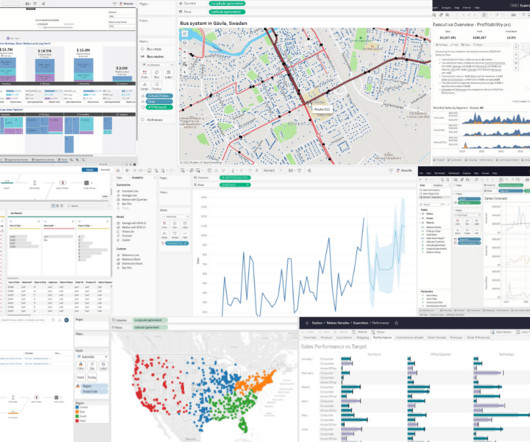
11 Innovative Data Visualizations you Should Learn (in Python, R, Tableau and D3.js)
Analytics Vidhya
AUGUST 26, 2019
Overview A look at 11 mind-blowing and innovative data visualizations in Python, R, Tableau and D3.js js These data visualizations span a variety of real-world. The post 11 Innovative Data Visualizations you Should Learn (in Python, R, Tableau and D3.js)


Let's personalize your content