article thumbnail

KDnuggets News, November 8: 5 Simple Steps to Master Python, SQL, Scikit-learn, PyTorch & Google Cloud • SQL for Data Visualization

KDnuggets

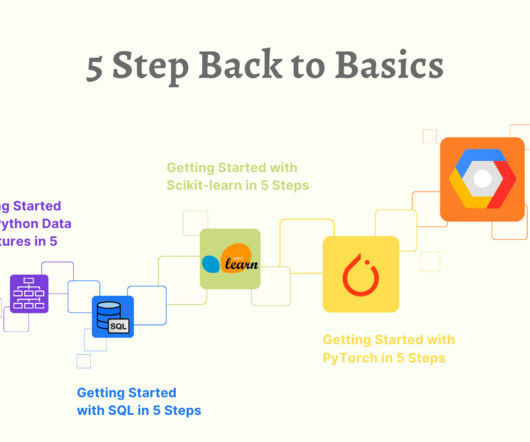
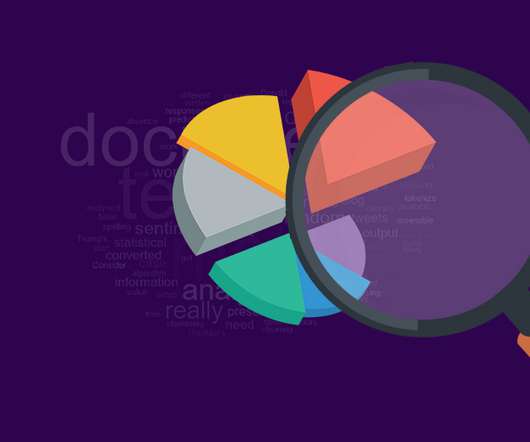
This week on KDnuggets: Dive into KDnuggets Back to Basics: Getting Started in 5 Steps series to help you master Python, SQL, Scikit-learn, PyTorch, and Google Cloud Platform. Unlock the Power of SQL in Data Visualization: Master the Art of Preparing Data for Impactful Charts and Graphs. •

SQL 239
article thumbnail

EDA – Exploratory Data Analysis Using Python Pandas and SQL

Analytics Vidhya

ArticleVideo Book This article was published as a part of the Data Science Blogathon Overview Python Pandas library is becoming most popular between data scientists. The post EDA – Exploratory Data Analysis Using Python Pandas and SQL appeared first on Analytics Vidhya.

professionals

Sign Up for our Newsletter

This site is protected by reCAPTCHA and the Google Privacy Policy and Terms of Service apply.

article thumbnail

Top 10 Python packages you need to master to maximize your coding productivity

Data Science Dojo

Python is a powerful and versatile programming language that has become increasingly popular in the field of data science. One of the main reasons for its popularity is the vast array of libraries and packages available for data manipulation, analysis, and visualization.

Python 329
article thumbnail

Top 10 Python packages you need to master to maximize your coding productivity

Data Science Dojo

Python is a powerful and versatile programming language that has become increasingly popular in the field of data science. One of the main reasons for its popularity is the vast array of libraries and packages available for data manipulation, analysis, and visualization.

Python 195
article thumbnail

7 Trending Open Source Tools for Data Visualization in 2023

ODSC - Open Data Science

Data visualization tools turn insights and data into something understandable, especially for non-data stakeholders who may not share the same skillsets as the team who’s behind the data. So let’s take a look at seven trending data visualization tools that have gotten quite a bit of attention on GitHub this year.

article thumbnail

Data science revolution 101 – Unleashing the power of data in the digital age

Data Science Dojo

The primary aim is to make sense of the vast amounts of data generated daily by combining statistical analysis, programming, and data visualization. It is divided into three primary areas: data preparation, data modeling, and data visualization.

article thumbnail

Empower your career – Discover the 10 essential skills to excel as a data scientist in 2023

Data Science Dojo

These skills include programming languages such as Python and R, statistics and probability, machine learning, data visualization, and data modeling. Data preparation is an essential step in the data science workflow, and data scientists should be familiar with various data preparation tools and best practices.