Remove Data Visualization Remove Database Remove White paper
article thumbnail

Graph visualization use cases

Cambridge Intelligence

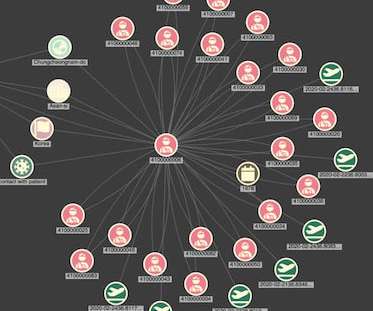
The challenge to understand hidden relationships and uncover actionable insights from data is universal, across countless data visualization use cases. In this blog post, we focus on seven of the most popular: Why visualize data as a graph? Data visualization makes it easy for us to identify trends and outliers.

article thumbnail

TigerGraph tutorial: how to integrate with ReGraph

Cambridge Intelligence

We’ve seen significant interest in TigerGraph’s fast, scalable graph database platform recently. In response, I put together this TigerGraph tutorial to create a React graph visualization application that integrates with their cloud database. Now we’ll create a database query that we can use in ReGraph.