


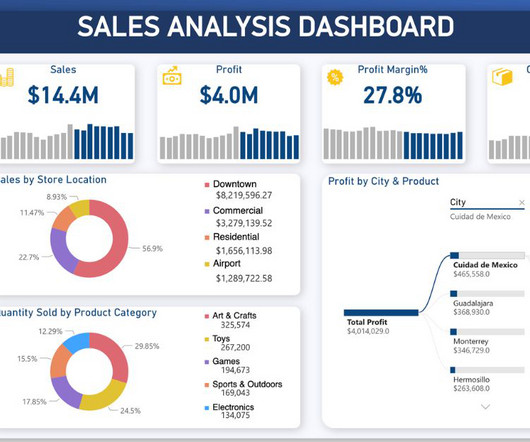
Streamlit vs Gradio – A Guide to Building Dashboards in Python
Analytics Vidhya
FEBRUARY 20, 2023
This blog is a tutorial for building intuitive frontend interfaces for Machine Learning models using two popular open-source libraries […] The post Streamlit vs Gradio – A Guide to Building Dashboards in Python appeared first on Analytics Vidhya.


Let's personalize your content