article thumbnail

Mastering Exploratory Data Analysis (EDA): A comprehensive guide

Data Science Dojo

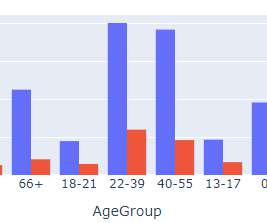
In this blog, we will discuss exploratory data analysis, also known as EDA, and why it is important. We will also be sharing code snippets so you can try out different analysis techniques yourself. This can be useful for identifying patterns and trends in the data. So, without any further ado let’s dive right in.

article thumbnail

Journeying into the realms of ML engineers and data scientists

Dataconomy

They employ statistical and mathematical techniques to uncover patterns, trends, and relationships within the data. Data scientists possess a deep understanding of statistical modeling, data visualization, and exploratory data analysis to derive actionable insights and drive business decisions.

professionals

Sign Up for our Newsletter

This site is protected by reCAPTCHA and the Google Privacy Policy and Terms of Service apply.

article thumbnail

Turn the face of your business from chaos to clarity

Dataconomy

Data scientists must decide on appropriate strategies to handle missing values, such as imputation with mean or median values or removing instances with missing data. The choice of approach depends on the impact of missing data on the overall dataset and the specific analysis or model being used.

article thumbnail

Life of modern-day alchemists: What does a data scientist do?

Dataconomy

Imagine data scientists as modern-day detectives who sift through a sea of information to uncover hidden patterns, trends, and correlations that can inform decision-making and drive innovation. Just like sifting through ancient artifacts, they meticulously clean and refine the data, preparing it for the grand unveiling.

article thumbnail

Netflix Data Analysis using Python

Mlearning.ai

In this blog, we’ll be using Python to perform exploratory data analysis (EDA) on a Netflix dataset that we’ve found on Kaggle. We’ll be using various Python libraries, including Pandas, Matplotlib, Seaborn, and Plotly, to visualize and analyze the data. The type column tells us if it is a TV show or a movie.

article thumbnail

Top 15 Data Analytics Projects in 2023 for beginners to Experienced

Pickl AI

Descriptive Analytics Projects: These projects focus on summarizing historical data to gain insights into past trends and patterns. Examples include generating reports, dashboards, and data visualizations to understand business performance, customer behavior, or operational efficiency.

article thumbnail

What is Data Pipeline? A Detailed Explanation

Smart Data Collective

The final point to which the data has to be eventually transferred is a destination. The destination is decided by the use case of the data pipeline. It can be used to run analytical tools and power data visualization as well. Otherwise, it can also be moved to a storage centre like a data warehouse or lake.