Remove category off-the-charts
article thumbnail

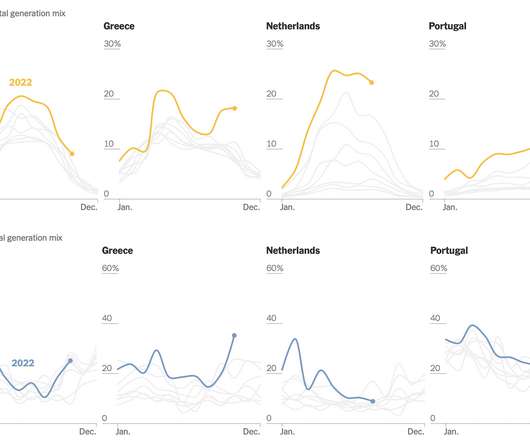
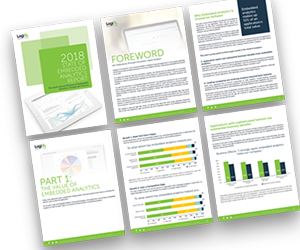
Shifts in European energy sources

FlowingData

With the war in Ukraine, Russia cut off natural gas supplies to other countries, but based on estimates from Ember, it looks like the biggest shifts recently are in other energy categories. Monthly line charts are used for each country and energy source. Monthly line charts are used for each country and energy source.

84
article thumbnail

Best of Tableau Web: October 2021

Tableau

The mix of design with storytelling is well balanced; the story [they’re] telling is very clear and so we have charts that are easy to read … Any decisions to go off the beaten track feel like they've been made with intent,” - An excerpt from my judge’s feedback on one of the winning #Viz4ClimateAction entries. Calculations.

Tableau 114
professionals

Sign Up for our Newsletter

This site is protected by reCAPTCHA and the Google Privacy Policy and Terms of Service apply.

article thumbnail

Multivariate Time Series Forecasting

Mlearning.ai

The Art of Forecasting in the Retail Industry Part I : Exploratory Data Analysis & Time Series Analysis In this article, I will conduct exploratory data analysis and time series analysis using a dataset consisting of product sales in different categories from a store in the US between 2015 and 2018.

article thumbnail

Best of Tableau Web: October 2021

Tableau

The mix of design with storytelling is well balanced; the story [they’re] telling is very clear and so we have charts that are easy to read … Any decisions to go off the beaten track feel like they've been made with intent.” . — Iron Viz isn’t the only viz competition on my radar right now. Klassen and Tudorancea/Tableau Public].

Tableau 96
article thumbnail

New Study: 2018 State of Embedded Analytics Report

Why do some embedded analytics projects succeed while others fail? We surveyed 500+ application teams embedding analytics to find out which analytics features actually move the needle. Read the 6th annual State of Embedded Analytics Report to discover new best practices. Brought to you by Logi Analytics.

article thumbnail

Elijah Meeks on Complex Data Visualization and its Uses

ODSC - Open Data Science

Fundamentally what I mean is not bar charts, line charts, pie charts, histograms, and all the other stuff. As newer fields emerge within data science and the research is still hard to grasp, sometimes it’s best to talk to the experts and pioneers of the field. It’s a really interesting question and a really interesting concept.

article thumbnail

Best of the Tableau Web: November 2021

Tableau

Fresh off of Tableau Conference , we are back with the Best of the Tableau Web! Search for sessions by category, starting with the Best of TC. December 11, 2021. For those who missed some or all of TC21, much of the content is available on demand—something that was especially important to me this year. Sarah Bartlett’s #Data21 recap.

Tableau 102