article thumbnail

Tableau: 9 years a Leader in Gartner Magic Quadrant for Analytics and Business Intelligence Platforms

Tableau

This week, Gartner published the 2021 Magic Quadrant for Analytics and Business Intelligence Platforms. I first want to thank you, the Tableau Community, for your continued support and your commitment to data, to Tableau, and to each other. Francois Ajenstat. Kristin Adderson. January 27, 2021 - 4:36pm. February 18, 2021.

Tableau 70
article thumbnail

Tableau: 9 years a Leader in Gartner Magic Quadrant for Analytics and Business Intelligence Platforms

Tableau

This week, Gartner published the 2021 Magic Quadrant for Analytics and Business Intelligence Platforms. I first want to thank you, the Tableau Community, for your continued support and your commitment to data, to Tableau, and to each other. Francois Ajenstat. Kristin Adderson. January 27, 2021 - 4:36pm. February 18, 2021.

Tableau 52
professionals

Sign Up for our Newsletter

This site is protected by reCAPTCHA and the Google Privacy Policy and Terms of Service apply.

article thumbnail

Everything You Need to know about Data Manipulation

Pickl AI

Moreover, this feature helps integrate data sets to gain a more comprehensive view or perform complex analyses. Data Cleaning Data manipulation provides tools to clean and preprocess data. Thus, Cleaning data ensures data quality and enhances the accuracy of analyses.

article thumbnail

How Data Cleansing Can Make or Break Your Business Analytics

Smart Data Collective

Big data technology has helped businesses make more informed decisions. A growing number of companies are developing sophisticated business intelligence models, which wouldn’t be possible without intricate data storage infrastructures. To Conclude – clean data makes for reliable analytics.

Analytics 109
article thumbnail

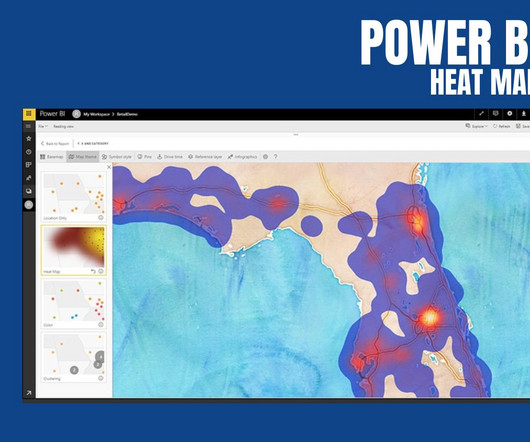
How to Create a Heatmap in Power BI?

Pickl AI

In a Power BI Heatmap, the darkest colour sports represent the highest data density which are followed by lighter shades, equally portionate to the density. Key Features of Power BI: Power BI is a powerful business intelligence tool developed by Microsoft that enables users to visualize and analyze data from various sources.

article thumbnail

The Best Data Management Tools For Small Businesses

Smart Data Collective

The extraction of raw data, transforming to a suitable format for business needs, and loading into a data warehouse. Data transformation. This process helps to transform raw data into clean data that can be analysed and aggregated. Data analytics and visualisation.

article thumbnail

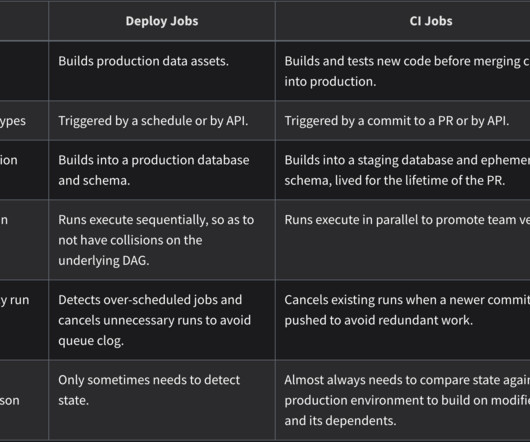
dbt Labs’ Coalesce 2023 Recap

phData

Sidebar Navigation: Provides a catalog sidebar for browsing resources by type, package, file tree, or database schema, reflecting the structure of both dbt projects and the data platform. Efficient Data Retrieval: Quick access to metric datasets from your data platform is made possible by MetricFlow’s optimized processes.