This site uses cookies to improve your experience. To help us insure we adhere to various privacy regulations, please select your country/region of residence. If you do not select a country, we will assume you are from the United States. Select your Cookie Settings or view our Privacy Policy and Terms of Use.
Cookie Settings
Cookies and similar technologies are used on this website for proper function of the website, for tracking performance analytics and for marketing purposes. We and some of our third-party providers may use cookie data for various purposes. Please review the cookie settings below and choose your preference.
Used for the proper function of the website
Used for monitoring website traffic and interactions
Cookie Settings
Cookies and similar technologies are used on this website for proper function of the website, for tracking performance analytics and for marketing purposes. We and some of our third-party providers may use cookie data for various purposes. Please review the cookie settings below and choose your preference.
Strictly Necessary: Used for the proper function of the website
Performance/Analytics: Used for monitoring website traffic and interactions
Visualization libraries available in Python such as Matplotlib and Seaborn, and tools like Tableau and Power BI become crucial to telling stories that lead to insights. To know more, read our article on what a Machine Learning engineer is. BusinessIntelligence (BI) Analyst Focuses on dash boarding, reporting, and KPI monitoring.
Data Analysis and Transition to Machine Learning: Skills: Python, SQL, Excel, Tableau and Power BI are relevant skills for entry-level data analysis roles. Data Tools Excel remains a fundamental tool for basic analysis, while Tableau, Power BI, Qlik Sense and QlikView offer advanced visualisation and businessintelligence capabilities.
This article was published as a part of the Data Science Blogathon. Introduction to Tableau Tips! Creating a chart or visual in Tableau is. The post 5 Tableau Tips for Designing a Tidy and Impactful Visualization appeared first on Analytics Vidhya.
This article was published as a part of the Data Science Blogathon. Introduction Tableau is a data visualization tool created in Salesforce that allows users to connect to any database, like SQL or MongoDB, and interact freely. The post Most Frequently Asked Tableau Interview Questions appeared first on Analytics Vidhya.
ArticleVideo Book This article was published as a part of the Data Science Blogathon. The post Make Your Tableau Visuals More Effective – Tips And Tricks appeared first on Analytics Vidhya. Introduction Data Visualization is a graphical way to represent data by.
As the use of intelligence technologies is staggering, knowing the latest trends in businessintelligence is a must. The market for businessintelligence services is expected to reach $33.5 top 5 key platforms that control the future of businessintelligence impacts BI may have on your business in the future.
Summary: Data Visualisation is crucial to ensure effective representation of insights tableau vs power bi are two popular tools for this. This article compares Tableau and Power BI, examining their features, pricing, and suitability for different organisations. What is Tableau? billion in 2023.
In today’s fast-paced business landscape, companies need to stay ahead of the curve to remain competitive. Businessintelligence (BI) has emerged as a key solution to help companies gain insights into their operations and market trends. What is businessintelligence?
In today’s fast-paced business landscape, companies need to stay ahead of the curve to remain competitive. Businessintelligence (BI) has emerged as a key solution to help companies gain insights into their operations and market trends. What is businessintelligence?
Director, Tableau Blueprint. But businessintelligence models have evolved beyond centralized, linear processes—it's time to leave behind historic notions of governance as restrictive and embrace a flexible governance framework that enables enterprise transformation. Want to learn more about Tableau Blueprint?
Applications : BusinessIntelligence : Power BI’s Copilot is especially valuable for business users who need to quickly derive insights from data without having extensive technical knowledge. It democratizes access to data analytics across an organization.
ArticleVideo Book This article was published as a part of the Data Science Blogathon. Introduction Data visualization is the practice of translating data into. The post Top 10 Data Visualization Tools appeared first on Analytics Vidhya.
Director, Tableau Blueprint. But businessintelligence models have evolved beyond centralized, linear processes—it's time to leave behind historic notions of governance as restrictive and embrace a flexible governance framework that enables enterprise transformation. Want to learn more about Tableau Blueprint?
The application presents a massive volume of unstructured data through a graphical or programming interface using the analytical abilities of businessintelligence technology to provide instant insight. In this article, we’re going to look at the top 5. Top 5 Tools for Building an Interactive Analytics App.
Editor's note: This article originally appeared in Forbes. But how can business leaders nurture that culture after it takes root? The impact of this positive feedback loop was quantified in a Tableau-sponsored IDC survey of enterprise leaders. Forbes BrandVoice. Christine Zuniga. August 6, 2021 - 6:51pm. August 11, 2021.
Editor's note: This article originally appeared in Forbes. And yet data access and the skills required to understand the data are, in many organizations, restricted to businessintelligence teams and IT specialists. “It Self-service learning. Success indicators.
Editor's note: This article originally appeared in Forbes , by Jennifer Day, Vice President, Customer Strategy and Programs, Tableau . Many businesses recently made strategic moves to build or enhance their data cultures, enabling people to make better, faster decisions as they faced unprecedented challenges. “A
Editor's note: This article originally appeared in Forbes , by Jennifer Day, Vice President, Customer Strategy and Programs, Tableau . Many businesses recently made strategic moves to build or enhance their data cultures, enabling people to make better, faster decisions as they faced unprecedented challenges. “A
There are many well-known libraries and platforms for data analysis such as Pandas and Tableau, in addition to analytical databases like ClickHouse, MariaDB, Apache Druid, Apache Pinot, Google BigQuery, Amazon RedShift, etc. You can even connect directly to 20+ data sources to work with data within minutes.
Summary: Power BI alternatives like Tableau, Qlik Sense, and Zoho Analytics provide businesses with tailored Data Analysis and Visualisation solutions. Introduction Power BI has become one of the most popular businessintelligence (BI) tools, offering powerful Data Visualisation, reporting, and decision-making features.
Editor's note: This article originally appeared in Forbes. But how can business leaders nurture that culture after it takes root? The impact of this positive feedback loop was quantified in a Tableau-sponsored IDC survey of enterprise leaders. Forbes BrandVoice. Christine Zuniga. August 6, 2021 - 6:51pm. August 11, 2021.
Data Visualization and BusinessIntelligenceTableauTableau has revolutionized data visualization, offering a user-friendly platform for creating interactive dashboards and reports. Power BI Microsoft’s Power BI is another popular businessintelligence tool, known for its integration with the broader Microsoft ecosystem.
With blogs, anyone can now write and distribute an article and with message boards anyone can post an advertisement. BusinessIntelligence used to require months of effort from BI and ETL teams. Today, you have Tableau, empowering any analyst to create a report. Publishing used to be the province of big newspapers.
Editor's note: This article originally appeared in Forbes. And yet data access and the skills required to understand the data are, in many organizations, restricted to businessintelligence teams and IT specialists. “It Self-service learning. Success indicators.
Ron Powell, independent analyst and industry expert for the BeyeNETWORK and executive producer of The World Transformed FastForward Series, interviews Adrian Quilis, Director of BusinessIntelligence at MercadoLibre. This article is based on a podcast with Adrian. And we try to spread all the information around the company.
Tableau Public Tableau Public , a powerful data visualization software, empowers users to create interactive and shareable dashboards with ease. What sets Tableau apart is its intuitive, user-friendly, drag-and-drop interface. Other elements make Tableau Public an excellent choice for data visualization experts.
In this article, I will explain the modern data stack in detail, list some benefits, and discuss what the future holds. Businessintelligence (BI) platforms. Later, BI tools such as Chartio, Looker, and Tableau arrived on the data scene. Examples of BI tools include Looker, Power BI , and Tableau.
Accessibility is one part of the “Intelligence Elevated” equation. By now, we’re all familiar with how self-service data can drive businessintelligence that helps the bottom line. This blog focuses on how that access is achieved. Bottom-line BI benchmarks. You have to be able to have a learner’s mindset.
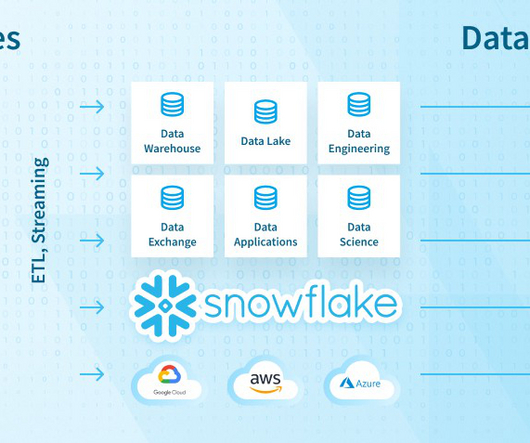
The demand for information repositories enabling businessintelligence and analytics is growing exponentially, giving birth to cloud solutions. In this article, you’ll discover what a Snowflake data warehouse is, its pros and cons, and how to employ it efficiently. What makes Snowflake so unique, and are there any caveats to it?
The Business Application Research Center (BARC) is a European analyst firm headquartered in Germany. The firm focuses on business software that supports businessintelligence, analytics, data management, and other key data areas. Download the full report. See the full case study. Big things on the horizon.
This article aims to guide readers in selecting the best AI and Machine Learning Courses to enhance their careers. hours of on-demand video 5 coding exercises 40 articles and 9 downloadable resources Full access on mobile and TV Data Science Job Guarantee Program by Pickl.AI Focus on Data Science tools and businessintelligence.
This article is based on a podcast Ron Powell conducted with Sharon Graves, Enterprise Data and BI Tools Evangelist for GoDaddy, about data curation, data stewardship, and data catalogs. His focus is on businessintelligence, analytics, big data, and data warehousing. For Tableau, you don’t have to be very technical.
This article aims to guide you through the intricacies of Data Analyst interviews, offering valuable insights with a comprehensive list of top questions. By the end of this article, you’ll explore data analytics certification courses that will significantly help you advance your career in the data domain.
BusinessIntelligence (BI) Tools BI tools like Tableau, Power BI, and QlikView provide comprehensive data manipulation features and advanced visualization capabilities. In this article, we have discussed some of the key aspects of Data Manipulation that will help you harness this technique for accurate data analysis.
Introduction Artificial Intelligence (AI) and Data Science are revolutionising how we analyse data, make decisions, and solve complex problems. This article explores how AI and Data Science complement each other, highlighting their combined impact and potential. Data Science Job Guarantee Course by Pickl.AI
This article was co-written by Manish Garg & Hakeem Lawrence A common challenge with many businessintelligence tools is building trust, often when there isn’t a data model and when various BI tools throughout the organization provide conflicting results. Thats where Omni steps in. Why Choose Omni?
We organize all of the trending information in your field so you don't have to. Join 17,000+ users and stay up to date on the latest articles your peers are reading.
You know about us, now we want to get to know you!
Let's personalize your content
Let's get even more personalized
We recognize your account from another site in our network, please click 'Send Email' below to continue with verifying your account and setting a password.


Let's personalize your content