This site uses cookies to improve your experience. To help us insure we adhere to various privacy regulations, please select your country/region of residence. If you do not select a country, we will assume you are from the United States. Select your Cookie Settings or view our Privacy Policy and Terms of Use.
Cookie Settings
Cookies and similar technologies are used on this website for proper function of the website, for tracking performance analytics and for marketing purposes. We and some of our third-party providers may use cookie data for various purposes. Please review the cookie settings below and choose your preference.
Used for the proper function of the website
Used for monitoring website traffic and interactions
Cookie Settings
Cookies and similar technologies are used on this website for proper function of the website, for tracking performance analytics and for marketing purposes. We and some of our third-party providers may use cookie data for various purposes. Please review the cookie settings below and choose your preference.
Strictly Necessary: Used for the proper function of the website
Performance/Analytics: Used for monitoring website traffic and interactions
Data analytics serves as a powerful tool in navigating the vast ocean of information available today. Organizations across industries harness the potential of data analytics to make informed decisions, optimize operations, and stay competitive in the ever-changing marketplace. What is data analytics?
Self-service analytics empowers users to independently analyze data, fostering a culture of data-driven decision-making within organizations. Self-service analytics tools enable individuals to create customized reports and visualizations, streamlining processes and enhancing communication across teams. What is self-service analytics?
Augmented analytics is revolutionizing how organizations interact with their data. By harnessing the power of machine learning (ML) and natural language processing (NLP), businesses can streamline their data analysis processes and make more informed decisions. What is augmented analytics?
For instance, Berkeley’s Division of Data Science and Information points out that entry level data science jobs remote in healthcare involves skills in NLP (Natural Language Processing) for patient and genomic data analysis, whereas remote data science jobs in finance leans more on skills in risk modeling and quantitative analysis.
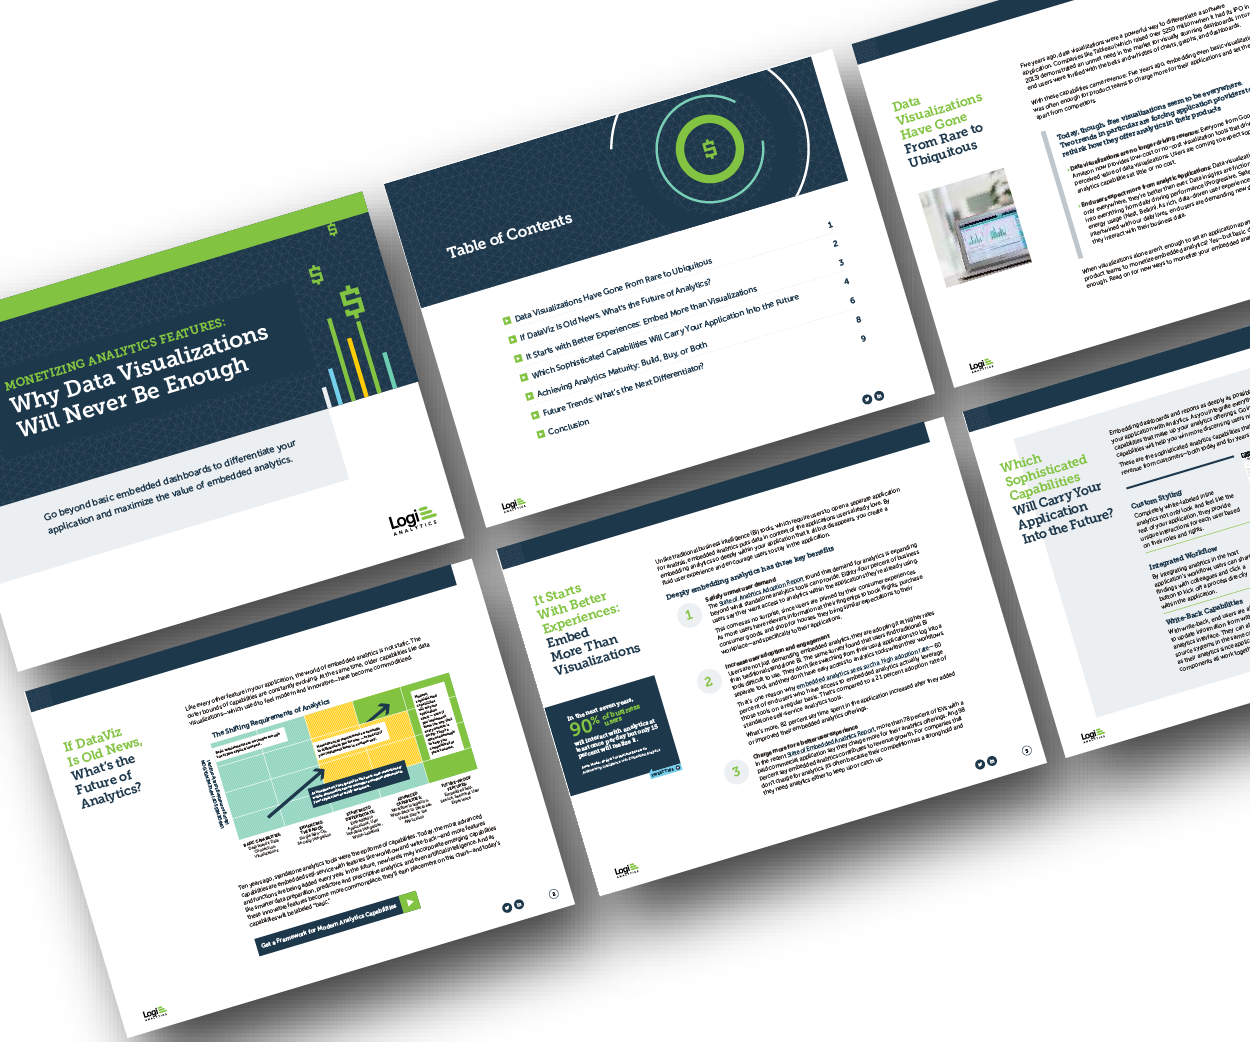
Discover which features will differentiate your application and maximize the ROI of your embedded analytics. Brought to you by Logi Analytics. But today, dashboards and visualizations have become table stakes.
Summary: Discover what a career in data analytics looks like in 2025. A career in data analytics could be your gateway to exciting opportunities, exceptional salaries, and significant professional growth. Businesses, governments, and organizations are generating massive amounts of information every day. What is Data Analytics?
By providing a centralized view of metadata, data catalogs facilitate better analytics, data governance, and decision-making processes. They enhance data governance by ensuring that data usage aligns with established policies, while also improving analytics capabilities through effective data management. What is a data catalog?
Solution overview This changed with GoDaddy Lighthouse, a generative AI-powered interactions analytics solution, which unlocks the rich mine of insights sitting within our customer care transcript data. Then, the insights produced for each interaction are aggregated and visualized in dashboards and other analytical tools.
Summary: Business Analytics focuses on interpreting historical data for strategic decisions, while Data Science emphasizes predictive modeling and AI. Introduction In today’s data-driven world, businesses increasingly rely on analytics and insights to drive decisions and gain a competitive edge. What is Business Analytics?
OLAP, or Online Analytical Processing, revolutionizes the way businesses analyze data. By enabling multidimensional analysis, it provides users the ability to dissect vast amounts of information quickly and efficiently. This integration allows for comprehensive quantitative evaluations, essential for various analytical tasks.
It plays a crucial role in decision-making processes across industries by simplifying complex information, facilitating real-time monitoring, and improving communication among stakeholders. In an era where attention spans are dwindling—averaging around 8 seconds—visualizations help convey information quickly and effectively.
The role demands both technical skills and business acumen, as Indian companies increasingly seek professionals who can align analytics with strategic goals. Exploratory Data Analysis (EDA): Identifying trends, patterns, and anomalies using statistical tools to understand data characteristics and inform modeling strategies.
5 AI stocks to buy in January and hold for the long haul Salesforce and its Agentforce solution Salesforce (CRM -2.77%) has consistently been a leader in customer relationship management (CRM) software, evolving by acquiring companies like Mulesoft, Tableau, and Slack to enhance its offerings in automation and analytics.
Summary: Use these Business Analyst interview questions to highlight your analytical expertise, stakeholder management, and agile methodologies. By reading further, you will learn how to confidently answer interview queries, highlight your analytical skills, and convey your ability to streamline business processes. billion in 2024.
Visualization libraries available in Python such as Matplotlib and Seaborn, and tools like Tableau and Power BI become crucial to telling stories that lead to insights. Their job is to ensure that data is made available, trusted, and organizedall of which are required for any analytics or machine-learning task.
content print ( content , end = "" , flush = True ) bot_response += content This captures the number of chunks and token usage information during streaming. For applications handling sensitive information, this control is often a legal requirement rather than a preference. Configuring Hugging Face Access for Llama 3.1
Whether you’re running small-scale analytics or managing enterprise-level data warehouses, these tips will help drive performance and meaningful business outcomes for your organization. Audit JDBC / ODBC drivers in third party tools (eg: Thoughtspot, Tableau, fivetran etc). Use Account Usage Views (e.g.,
Heres how they enhance the power of Data Science: Predictive Analytics: ML algorithms can predict customer behaviour, enabling businesses to tailor marketing strategies. Example: IBM Watson Health uses AI-powered analytics for cancer treatment recommendations. Example: Netflix uses ML to recommend shows based on viewing history.
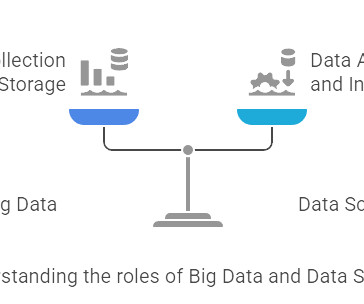
Data Science, on the other hand, uses scientific methods and algorithms to analyses this data, extract insights, and inform decisions. The Ocean of Information At its heart, Big Data refers to extremely large, complex datasets that are generated at high speed from various sources. What is Data Science?
Descriptive analytics is a fascinating area of data analytics that allows businesses to look back and glean insights from their historical data. This foundational aspect of data analytics is essential for any organization seeking to improve its performance and stay competitive. What is descriptive analytics?
Data Analysis and Transition to Machine Learning: Skills: Python, SQL, Excel, Tableau and Power BI are relevant skills for entry-level data analysis roles. Data Tools Excel remains a fundamental tool for basic analysis, while Tableau, Power BI, Qlik Sense and QlikView offer advanced visualisation and business intelligence capabilities.
July 2025) 67 points by whoishiring 10 hours ago | hide | past | favorite | 170 comments Share your information if you are looking for work. I help businesses and public agencies improve their operations through industry-leading management analytics strategies. Mking informed decisions for your team and tech stack.
As we already know from reading other blogs here on the phData website, Alteryx Server provides a scalable server-based analytics solution that lets you create, publish, and share analytic applications, schedule and automate workflow jobs with increased processing power, create, manage, and share data connections, and control data access.
Ultimately, leveraging Big Data analytics provides a competitive advantage and drives innovation across various industries. Introduction to Big Data Tools In todays data-driven world, organisations are inundated with vast amounts of information generated from various sources, including social media, IoT devices, transactions, and more.
Data scientists play a crucial role in today’s data-driven world, where extracting meaningful insights from vast amounts of information is key to organizational success. A data scientist integrates data science techniques with analytical rigor to derive insights that drive action. What is a data scientist?
Without data engineering , companies would struggle to analyse information and make informed decisions. It is commonly used for analytics and business intelligence, helping organisations make data-driven decisions. It helps organisations understand their data better and make informed decisions.
Business analytics is a powerful enabler for organizations seeking to harness the quintessence of information to optimize performance and drive strategic initiatives. It delves beyond mere data collection, engaging in the processes of extracting meaningful insights to inform better business decisions. What is business analytics?
These features cut down the time required for a person to go through extended audio or video recordings to find the information they need. It uses artificial intelligence to do something that old-school analytics cant: make sense of all the different ways people express their thoughts and feelings about your app or service.
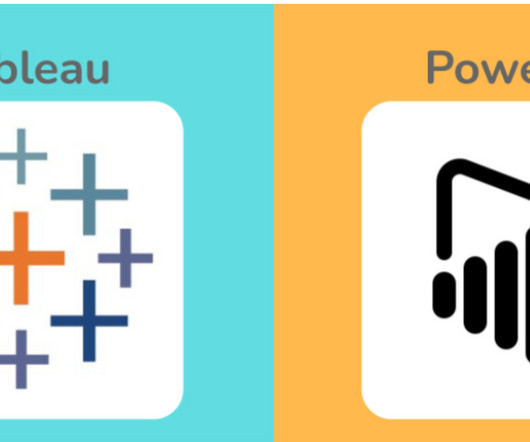
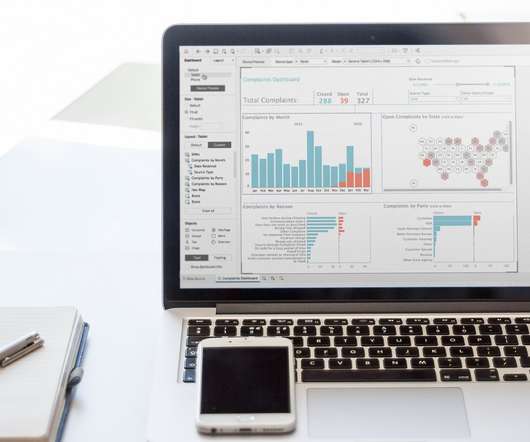
Efficient decision-making is the result of combining information, analysis, and effectiveness. Power BI and Tableau, popular and user-friendly data visualization tools, help businesses organize large datasets. That’s why businesses of all types and sizes are embracing data visualization, albeit often with a simplified approach.
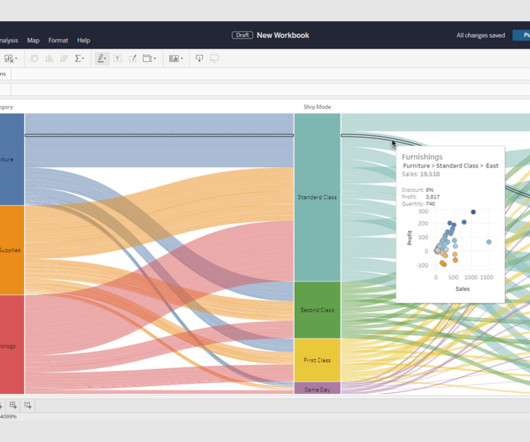
Introduction In the world of data analytics, where every piece of information holds untapped potential, the ability to transform raw data into actionable insights is a game-changer. Tableau, a dynamic and versatile data visualization tool, has revolutionized how organizations harness the power of their data.
Every information is at the grasp of our palms. The post 8 Business Analytics Books to Begin Your Journey appeared first on Analytics Vidhya. Introduction The global spread of the internet has made the availability of knowledge easy.
Data visualization is the art of presenting complex information in a way that is easy to understand and analyze. Data visualization in business analytics Importance of data visualization in business analytics Data visualization is the process of presenting data in a graphical or pictorial format.
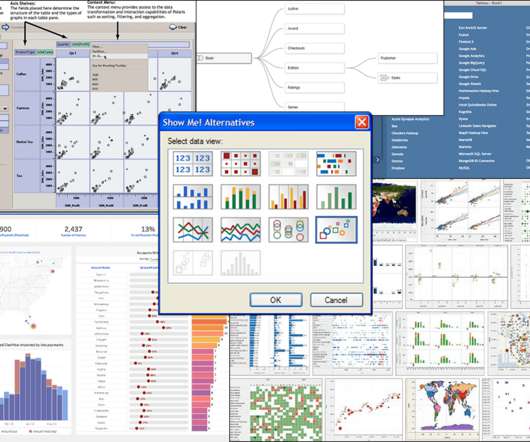
This feature was inspired by the New Chart Type Pilot on Tableau Public in spring 2023, where we saw excitement from our DataFam in how new visualizations were introduced. We wanted to empower the community to play an active role in the designing and developing their own viz types they use in Tableau. What are Viz Extensions?
Chief Product Officer, Tableau. It's more important than ever in this all digital, work from anywhere world for organizations to use data to make informed decisions. Data is stuck in siloes, infrastructure can’t scale to meet growing data needs, and analytics is still too hard for most people to use. Francois Ajenstat.
Kristin Adderson September 8, 2023 - 2:29am September 12, 2023 At Dreamforce 2023, the Tableau keynote was packed with innovations that will empower everyone as we charge ahead into the AI Revolution. That’s why it’s never been more essential for companies to create a comprehensive analytics strategy and become data-driven.
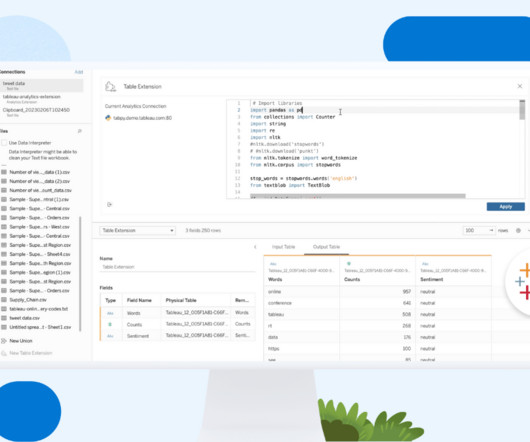
Product Manager, Tableau. First thing’s first: I am thrilled to announce that Tableau’sanalytics extensions are now available in Tableau Online! Starting with R integration in Tableau 8.3, All of these steps have led up to support for integrating Python, R, and other analytics extensions in Tableau Online.
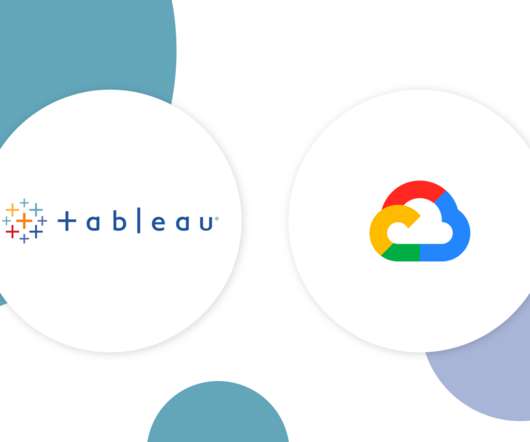
Tableau is a leader in the analytics market, known for helping organizations see and understand their data, but we recognize that gaps still exist: while many of our joint customers already benefit from dbt and trust the metrics that result from these workflows, they are often disconnected and obscured from Tableau’sanalytics layer.
Swetha Bezawada Senior Data Scientist Colten Woo September 26, 2023 - 6:57pm October 2, 2023 The typical analytical ecosystem has two silos: business intelligence and data science. Analytics Extensions do just that! At the root, an Analytics Extension is a server that you stand up to receive data from Tableau in real-time.
Generative AI (GenAI) is stepping in to change the game by making data analytics accessible to everyone. As data keeps growing, tools powered by Generative AI for data analytics are helping businesses and individuals tap into this potential, making decisions faster and smarter. How is Generative AI Different from Traditional AI Models?
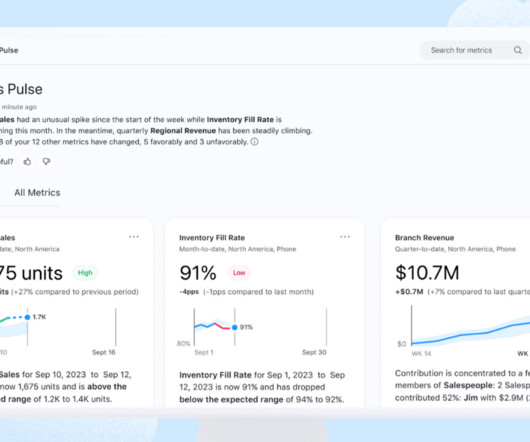
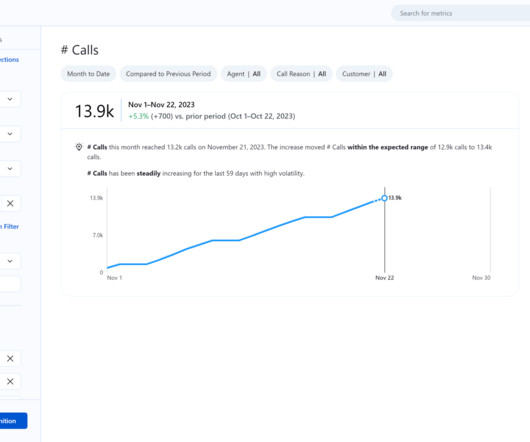
Tableau has been on a long journey to provide natural language interfaces for analytics. We are truly excited about Tableau Pulse , launched in a wide beta in December 2023 and planned for general availability in Tableau 2024.1. One answer is the complexity of data and analytical tools.
Spencer Czapiewski September 12, 2024 - 8:38pm Karen Madera Senior Manager, Product Marketing, Tableau We’re in the midst of an autonomous revolution that’s reshaping the way businesses use data to gain a competitive edge, delight customers, and engage employees. View the demo to see Tableau Einstein in action: What is Tableau Einstein?
Technical Fellow, Tableau. Tableau has been helping people and organizations to see and understand data for almost two decades, bringing exciting innovations to the landscape of business intelligence with every product release. I am proud to announce that my History of Tableau Innovation viz is now published to Tableau Public.
It’s one of our guiding principles at Tableau and why we support students and instructors around the globe through Tableau Academic Programs. Our mission is to lower the barrier of entry to learning analytics and build data literacy skills in future generations. . Data skills are also interdisciplinary.
Kristin Adderson June 11, 2024 - 4:53pm Noel Carter Senior Product Marketing Manager, Tableau Evan Slotnick Product Management Director, Tableau At the Tableau Conference 2024 keynote , Tableau CEO Ryan Aytay spoke about the new wave of analytics: the consumerization of data. That’s why we created Tableau+.
We organize all of the trending information in your field so you don't have to. Join 17,000+ users and stay up to date on the latest articles your peers are reading.
You know about us, now we want to get to know you!
Let's personalize your content
Let's get even more personalized
We recognize your account from another site in our network, please click 'Send Email' below to continue with verifying your account and setting a password.


Let's personalize your content