
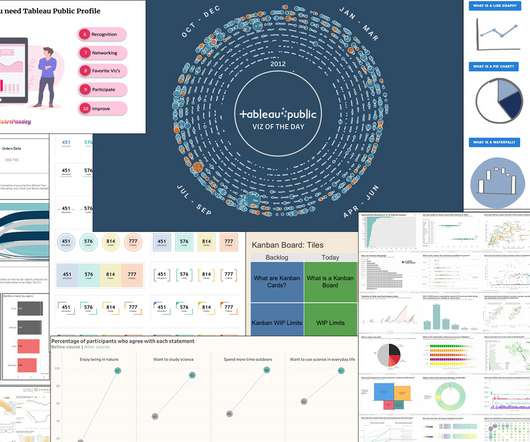
Best of Tableau Web: May 2021
Tableau
JUNE 4, 2021
June 5, 2021 - 12:10am. June 5, 2021. Welcome to our monthly highlight of data viz tips, tricks and inspiration produced by the Tableau Community. Tamara Allcock, The Data School : Tableau Prep: A Great Way to Get Squeaky Clean Data. Carl Allchin, Preppin’ Data : How to… use String functions. .


Let's personalize your content