
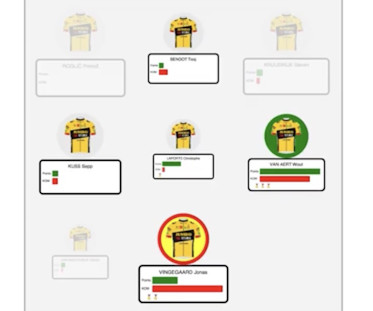
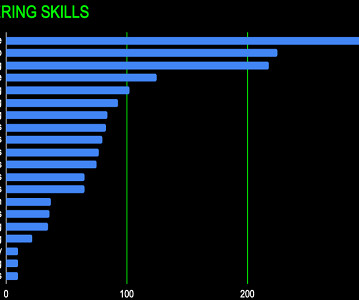
Visualizing the Tour de France in the year I tackle the route
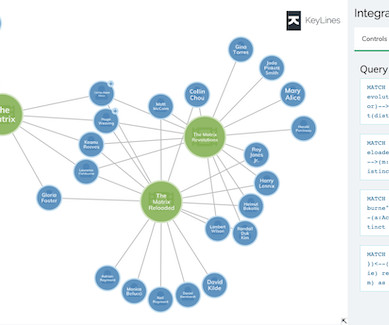
Cambridge Intelligence
JUNE 28, 2023
In the lead up to this, my day job as a software developer gave me a break from hard training rides, but my love of cycling sparked a mini side project: building web apps with the data visualization tools I help to develop, and using them to analyze and visualize Tour de France data.


Let's personalize your content