
Best of Tableau Web: August 2021
Tableau
AUGUST 23, 2021
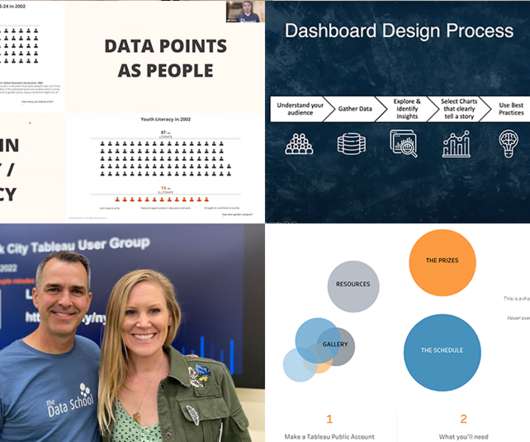
Technical Evangelist Director, Tableau. Zen Master Steve Wexler has been blogging about survey data longer than most people have been using Tableau. ( The first post I could find on his blog about the topic is from 2013! ). Tableau Zen Master Steve Wexler once used a “classic” divergent stacked bar approach. Calculations.


Let's personalize your content