Building a Formula 1 Streaming Data Pipeline With Kafka and Risingwave
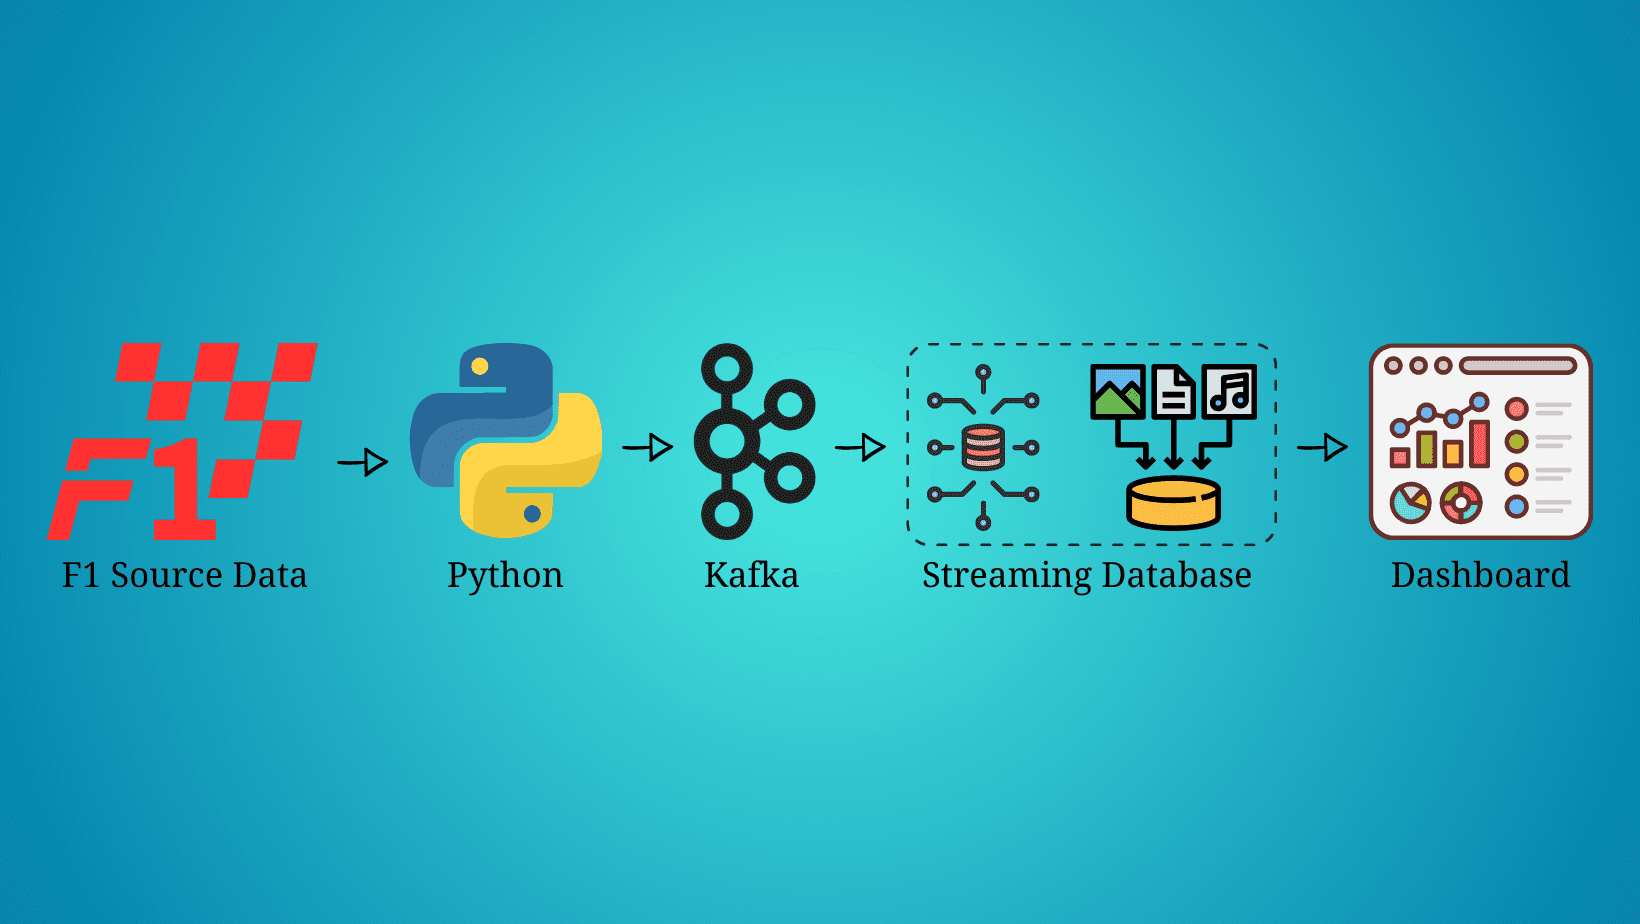
Build a streaming data pipeline using Formula 1 data, Python, Kafka, RisingWave as the streaming database, and visualize all the real-time data in Grafana.
Real-time data has arrived and is here to stay. There’s no doubt that every day the amount of streaming data increases exponentially and we need to find the best way to extract, process, and visualize it. For instance, each Formula 1 car produces around 1.5 terabytes of data through a race weekend (source).
In this article, we are not going to stream the car’s data, but we will be streaming, processing, and visualizing the race’s data simulating we’re live on a Formula 1 race. Before we get started, it’s important to mention that this article will not be focused on what each technology is, but on how to implement them in a streaming data pipeline, so some knowledge about Python, Kafka, SQL, and data visualization is expected.
Prerequisites
- F1 Source Data: The Formula 1 data used in this data streaming pipeline was downloaded from Kaggle and can be found as Formula 1 World Championship (1950 - 2023).
- Python: Python 3.9 was used to build this pipeline, but any version greater than 3.0 should work. Further details on how to download and install Python can be found on the official Python website.
- Kafka: Kafka is one of the main technologies used in this streaming pipeline, so it’s important to have it installed before you get started. This streaming pipeline was built on MacOS, so brew was used to install Kafka. More details can be found on the official brew website. We also need a Python library to use Kafka with Python. This pipeline uses kafka-python. Installation details can be found on their official website.
- RisingWave (Streaming Database): There are multiple streaming databases available in the market, but the one used in this article and one of the best is RisingWave. Getting started with RisingWave is pretty simple and it only takes a couple of minutes. A full tutorial on how to get started can be found on their official website.
- Grafana Dashboard: Grafana was used in this streaming pipeline to visualize the Formula 1 data in real time. Details on how to get started can be found on this website.
Streaming the Source Data
Now that we have all the prerequisites, it’s time to start building the Formula 1 data streaming pipeline. The source data is stored in a JSON file, so we have to extract it and send it through a Kafka topic. To do so, we will be using the below Python script.
Code by Author
Setting up Kafka
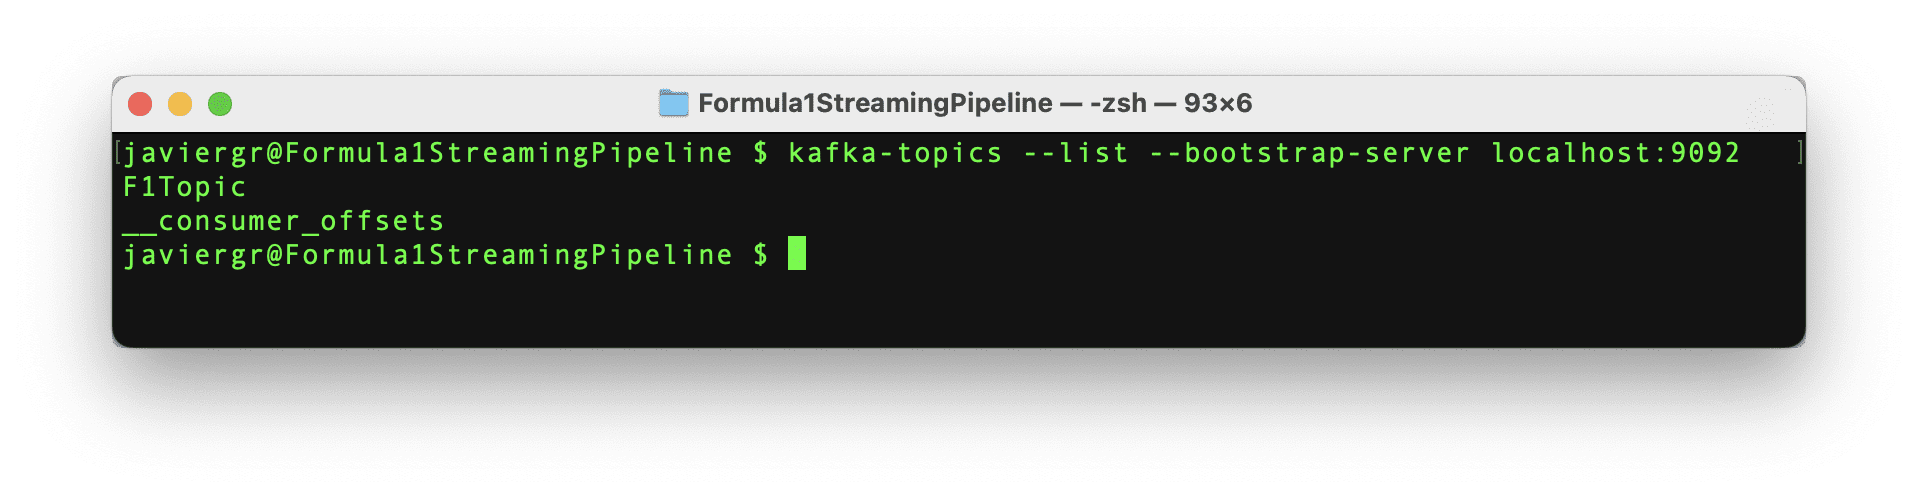
The Python script to stream the data is all set to start streaming the data, but the Kafka topic F1Topic is not created yet, so let’s create it. First, we need to initialize Kafka. To do so, we have to start Zookeper, then start Kafka, and finally create the topic with the below commands. Remember that Zookeper and Kafka should be running in a separate terminal.
Code by Author
Setting up the Streaming Database RisingWave
Once RisingWave is installed, it’s very easy to start it. First, we need to initialize the database and then we have to connect to it via the Postgres interactive terminal psql. To initialize the streaming database RisingWave, we have to execute the below command.
Code by Author
The above command launches RisingWave in playground mode, where data is temporarily stored in memory. The service is designed to automatically terminate after 30 minutes of inactivity, and any data stored will be deleted upon termination. This method is recommended for tests only, RisingWave Cloud should be used for production environments.
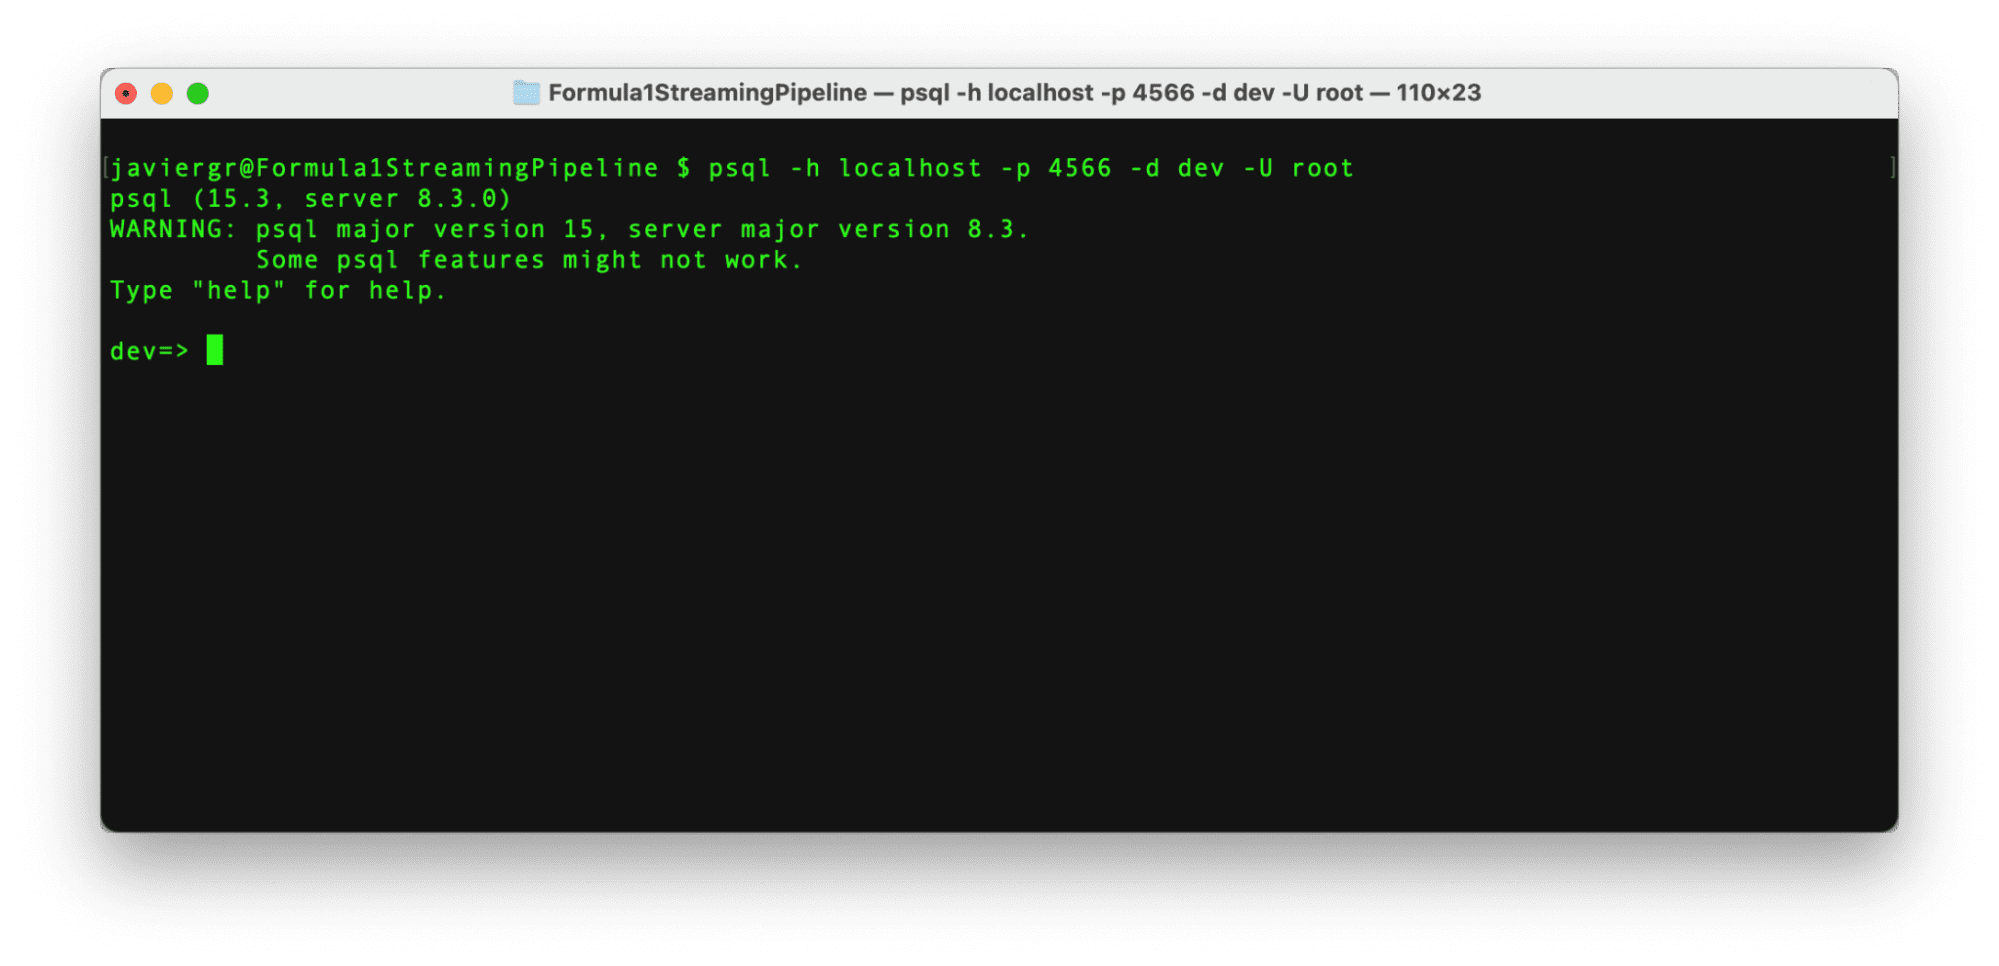
After RisingWave is up and running, it’s time to connect to it in a new terminal via the Postgress interactive terminal with the below command.
Code by Author
With the connection established, it’s time to start pulling the data from the Kafka topic. In order to get the streaming data into RisingWave we need to create a source. This source will establish the communication between the Kafka topic and RisingWave, so let’s execute the below command.
Code by Author
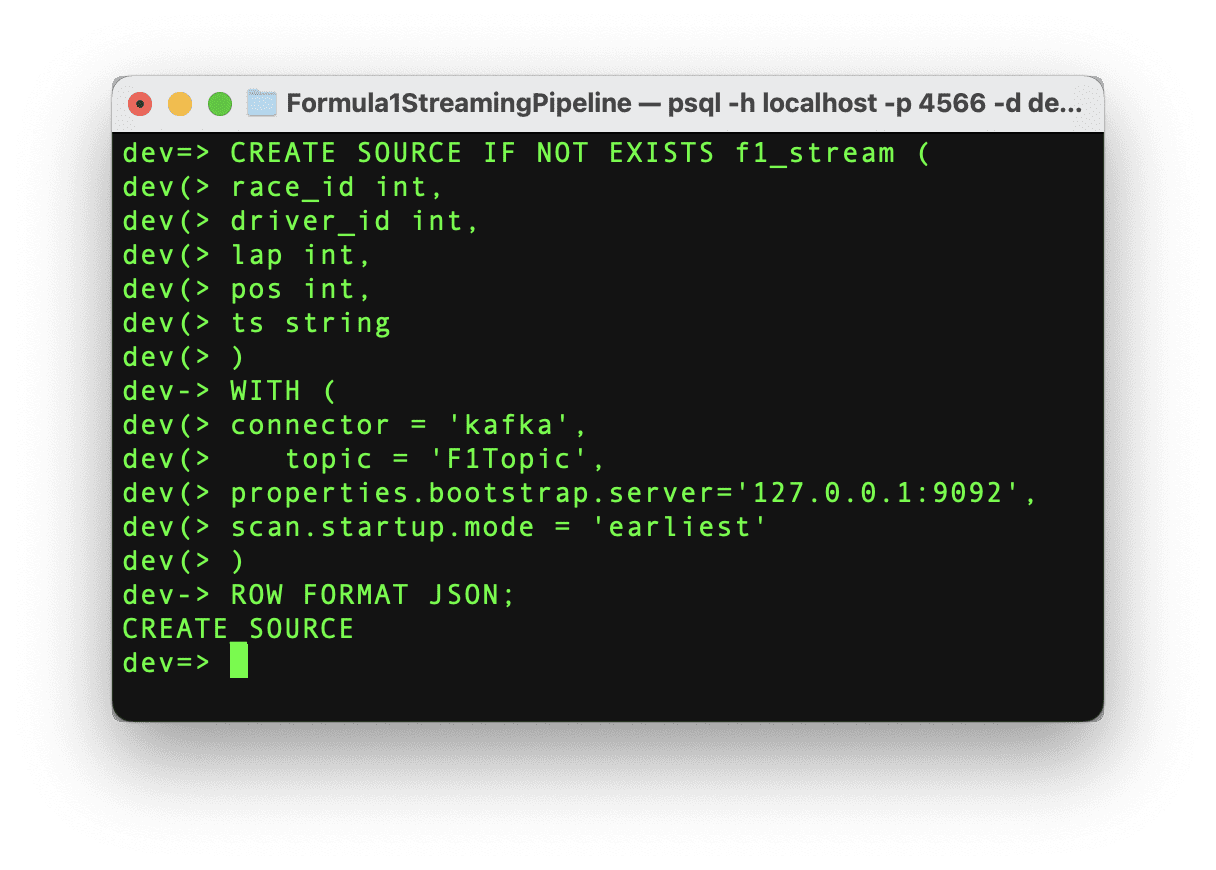
If the command runs successfully, then we can see the message “CREATE SOURCE” and the source has been created. It’s important to highlight that once the source is created, the data is not ingested into RisingWave automatically. We need to create a materialized view to start the data movement. This materialized view will also help us to create the Grafana dashboard in the next step.
Let’s create the materialized view with the same schema as the source data with the following command.
Code by Author
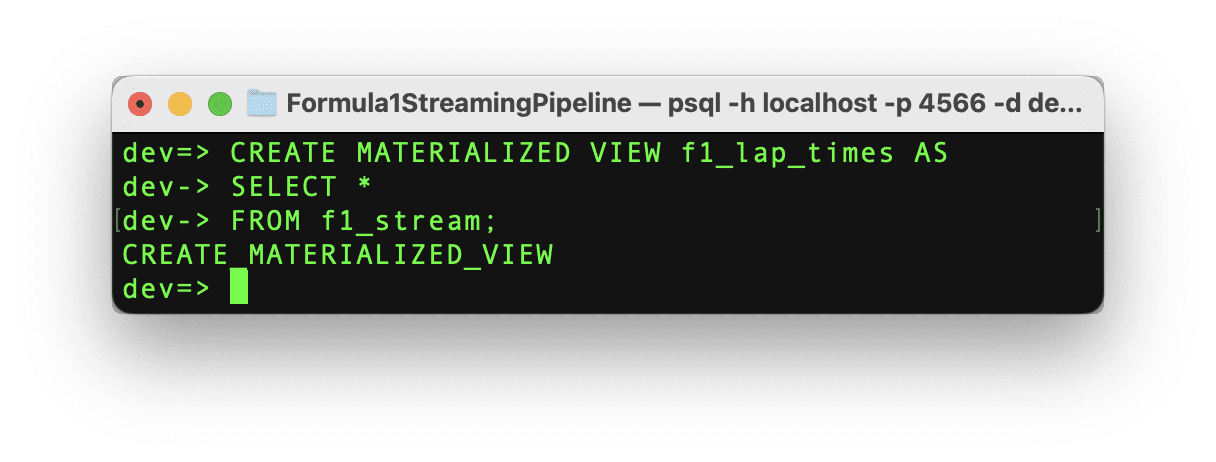
If the command runs successfully, then we can see the message “CREATE MATERIALIZED_VIEW” and the materialized view has been created and now it’s time to test it out!
Execute the Python script to start streaming the data and in the RisingWave terminal query the data in real time. RisingWave is a Postgres-compatible SQL database, so if you are familiar with PostgreSQL or any other SQL database everything will flow smoothly to query your streaming data.
As you can see the streaming pipeline is now up and running, but we are not taking all the advantages of the streaming database RisingWave. We can add more tables to join data in real time and build a fully functional application.
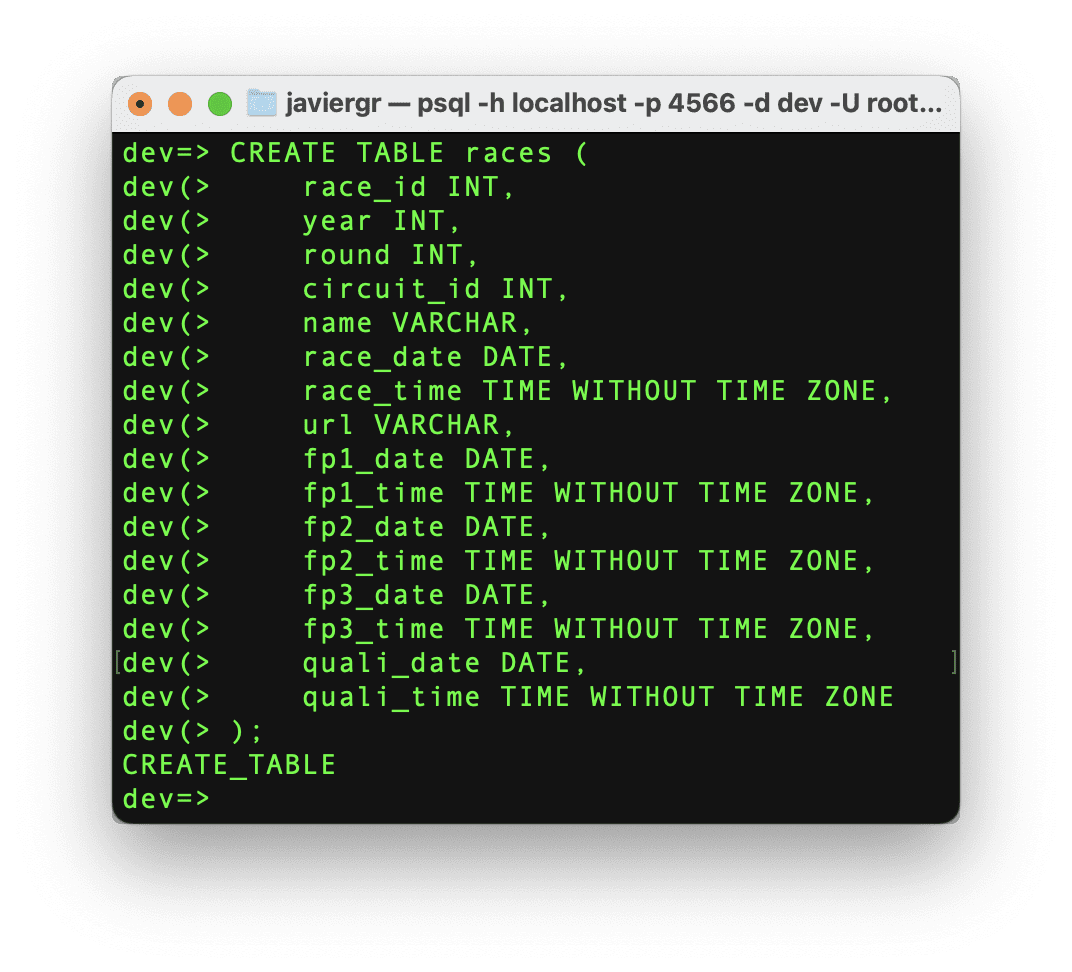
Let’s create the races table so we can join the streaming data with the race table and get the actual name of the race instead of the race id.
Code by Author
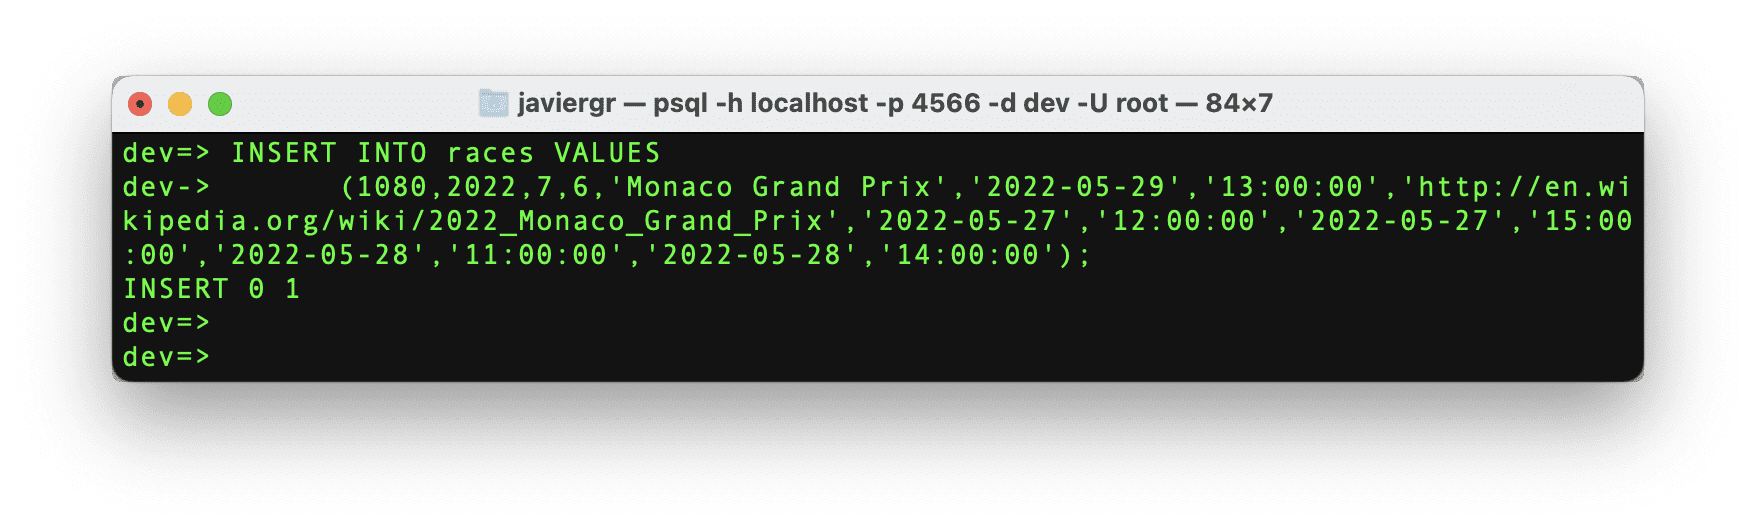
Now, let’s insert the data for the specific race id that we need.
Code by Author
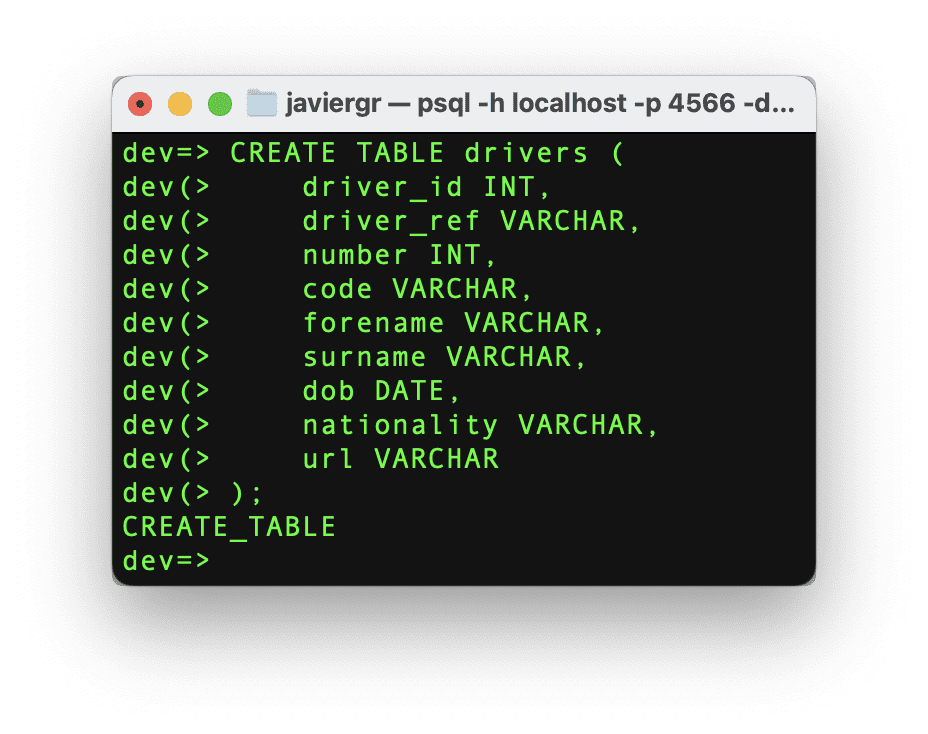
Let’s follow the same procedure but with the driver’s table.
Code by Author
And finally, let’s insert the driver’s data.
Code by Author
We have the tables ready to start joining the streaming data, but we need the materialized view where all the magic will happen. Let’s create a materialized view where we can see the top 3 positions in real-time, joining the driver id and the race id to get the actual names.
Code by Author
Last, but not least let’s create the last materialized view to see how many times a driver got the position number one during the whole race.
Code by Author
And now, it’s time to build the Grafana dashboard and see all the joined data in real-time thanks to the materialized views.
Setting up the Grafana Dashboard
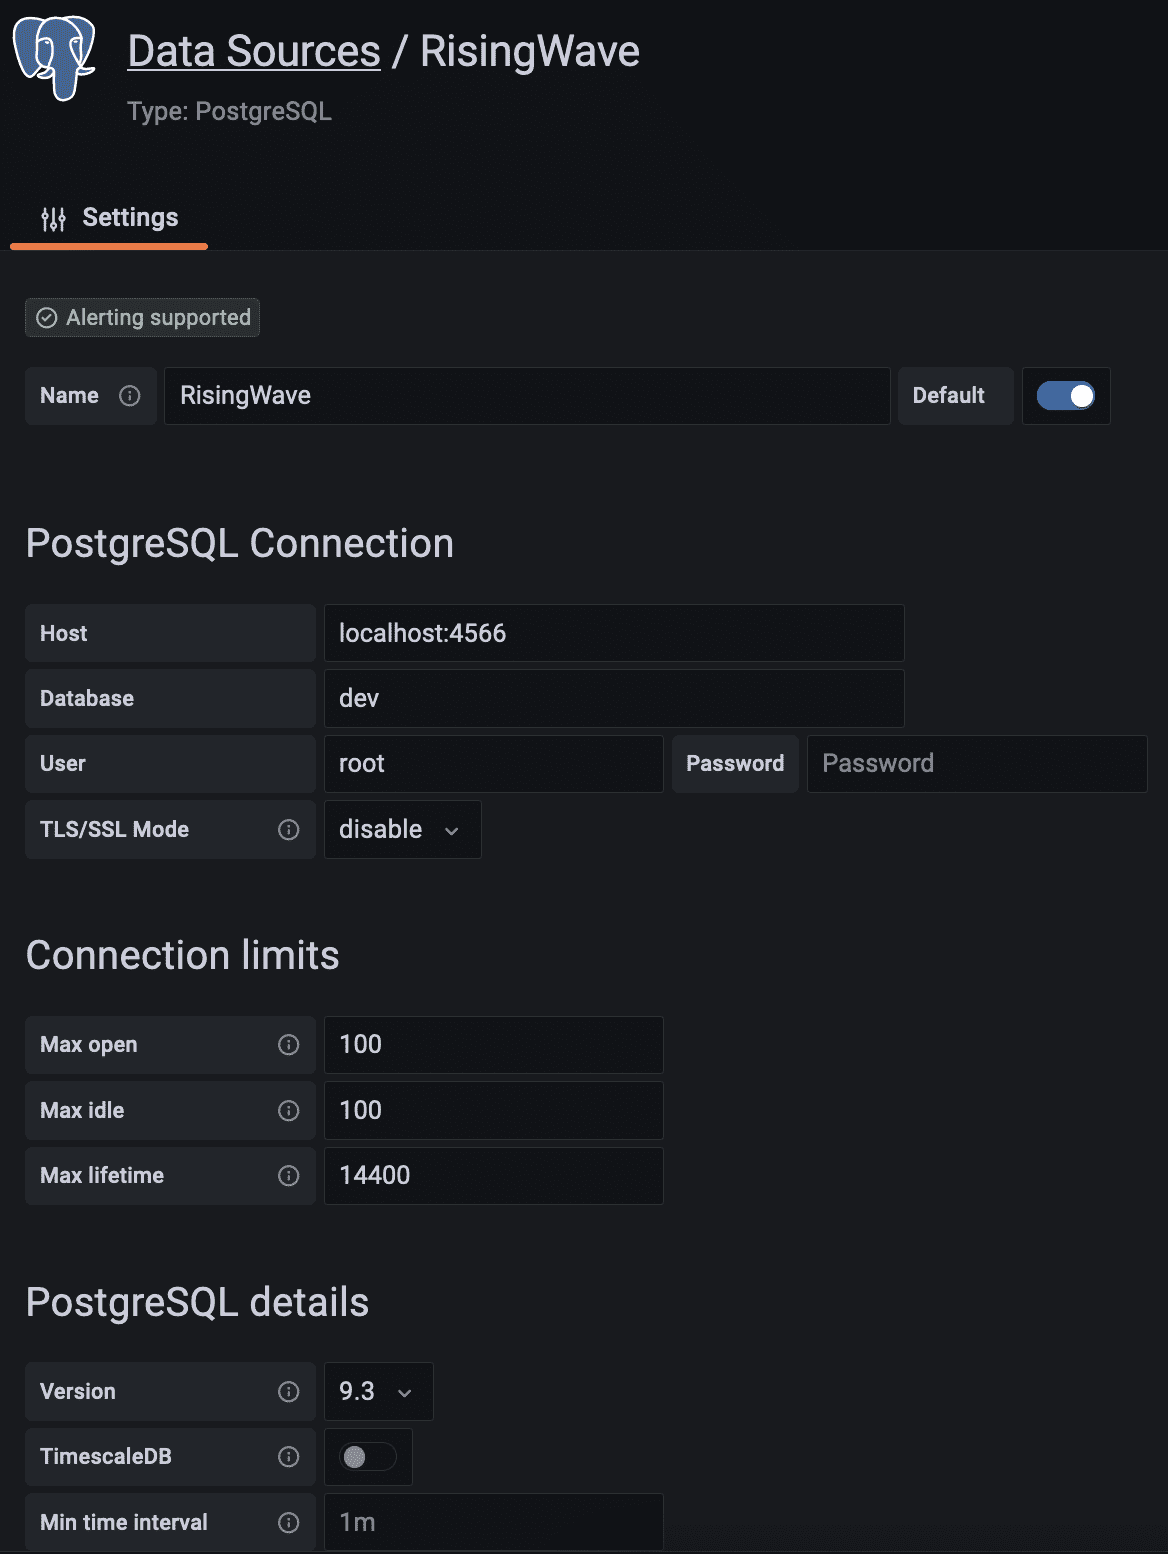
The final step in this streaming data pipeline is visualizing the streaming data in a real-time dashboard. Before we create the Gafana dashboard, we need to create a data source to establish the connection between Grafana and our streaming database RisingWave following the below steps.
- Go to Configuration > Data sources.
- Click the Add data source button.
- Select PostgreSQL from the list of supported databases.
- Fill in the PostgreSQL Connection fields like so:
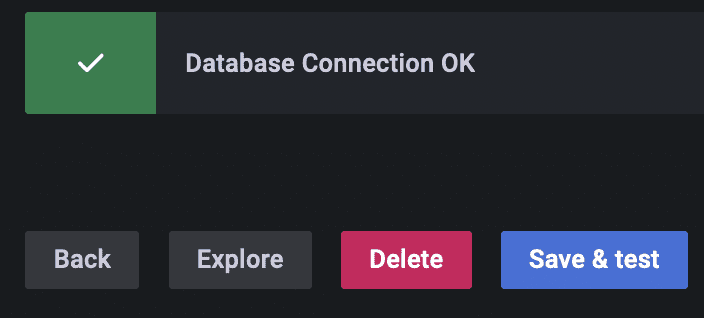
Scroll down and click on the save and test button. The database connection is now established.
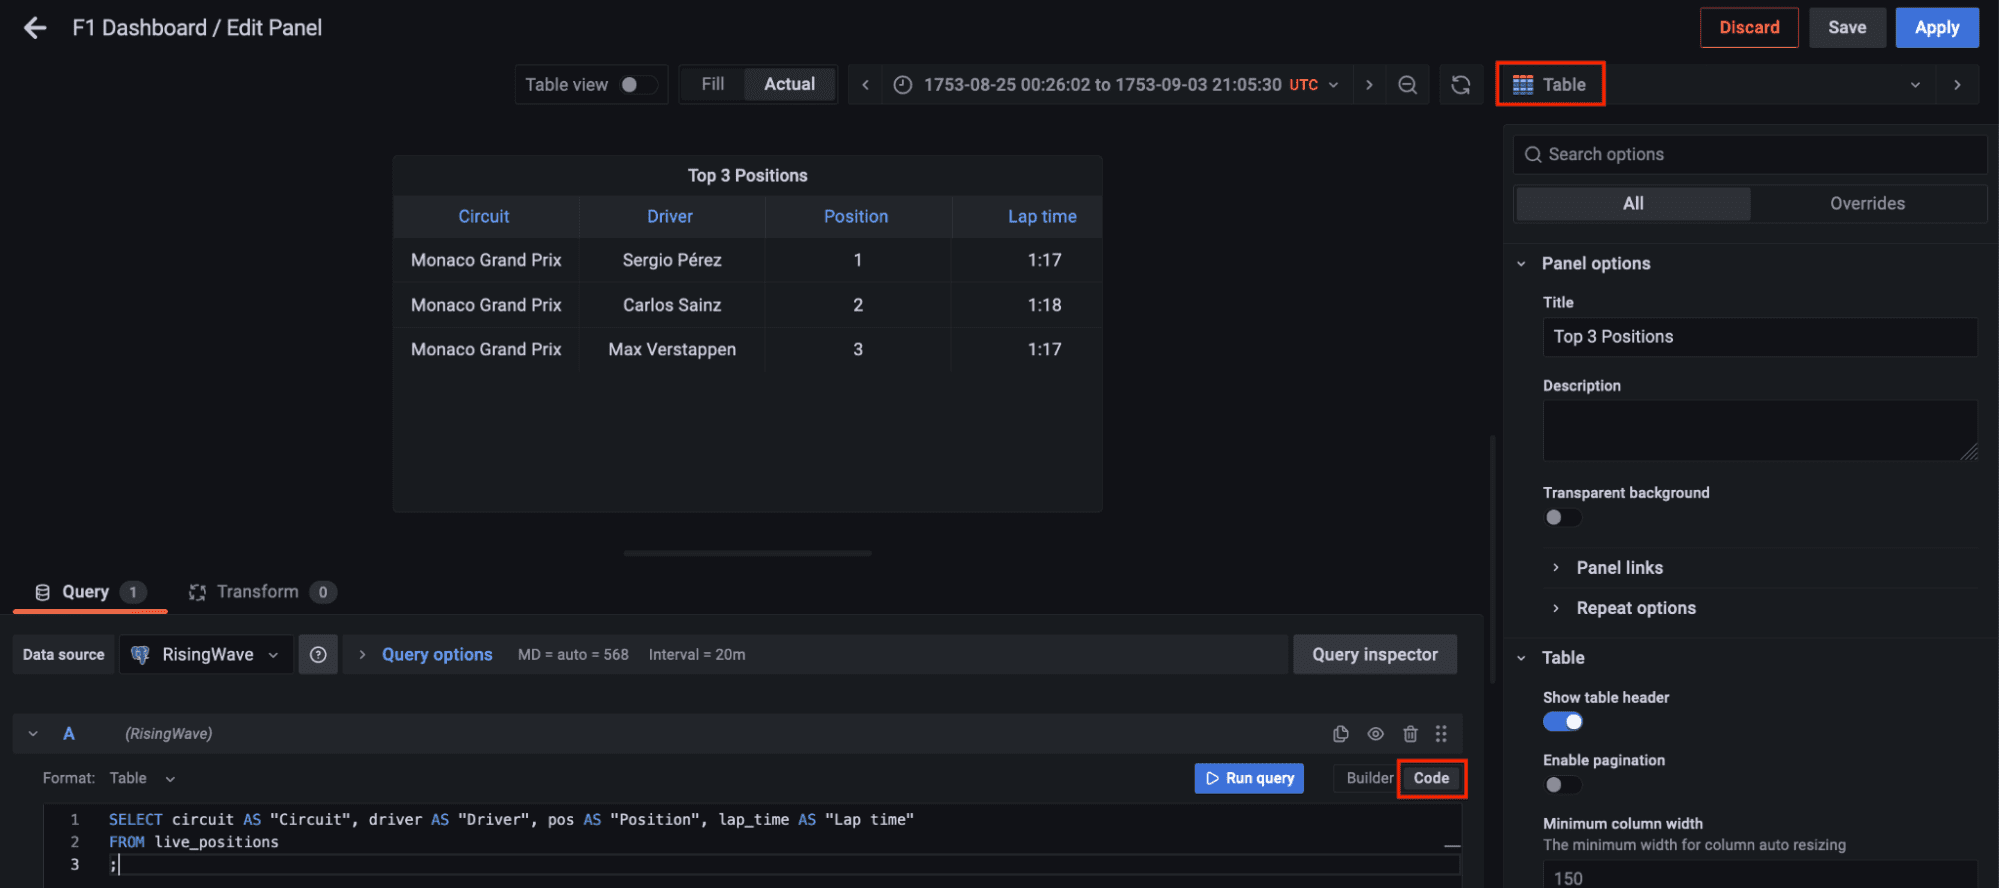
Now go to dashboards in the left panel, click on the new dashboard option, and add a new panel. Select the table visualization, switch to the code tab, and let’s query the materialized view live_positions where we can see the joined data for the top 3 positions.
Code by Author
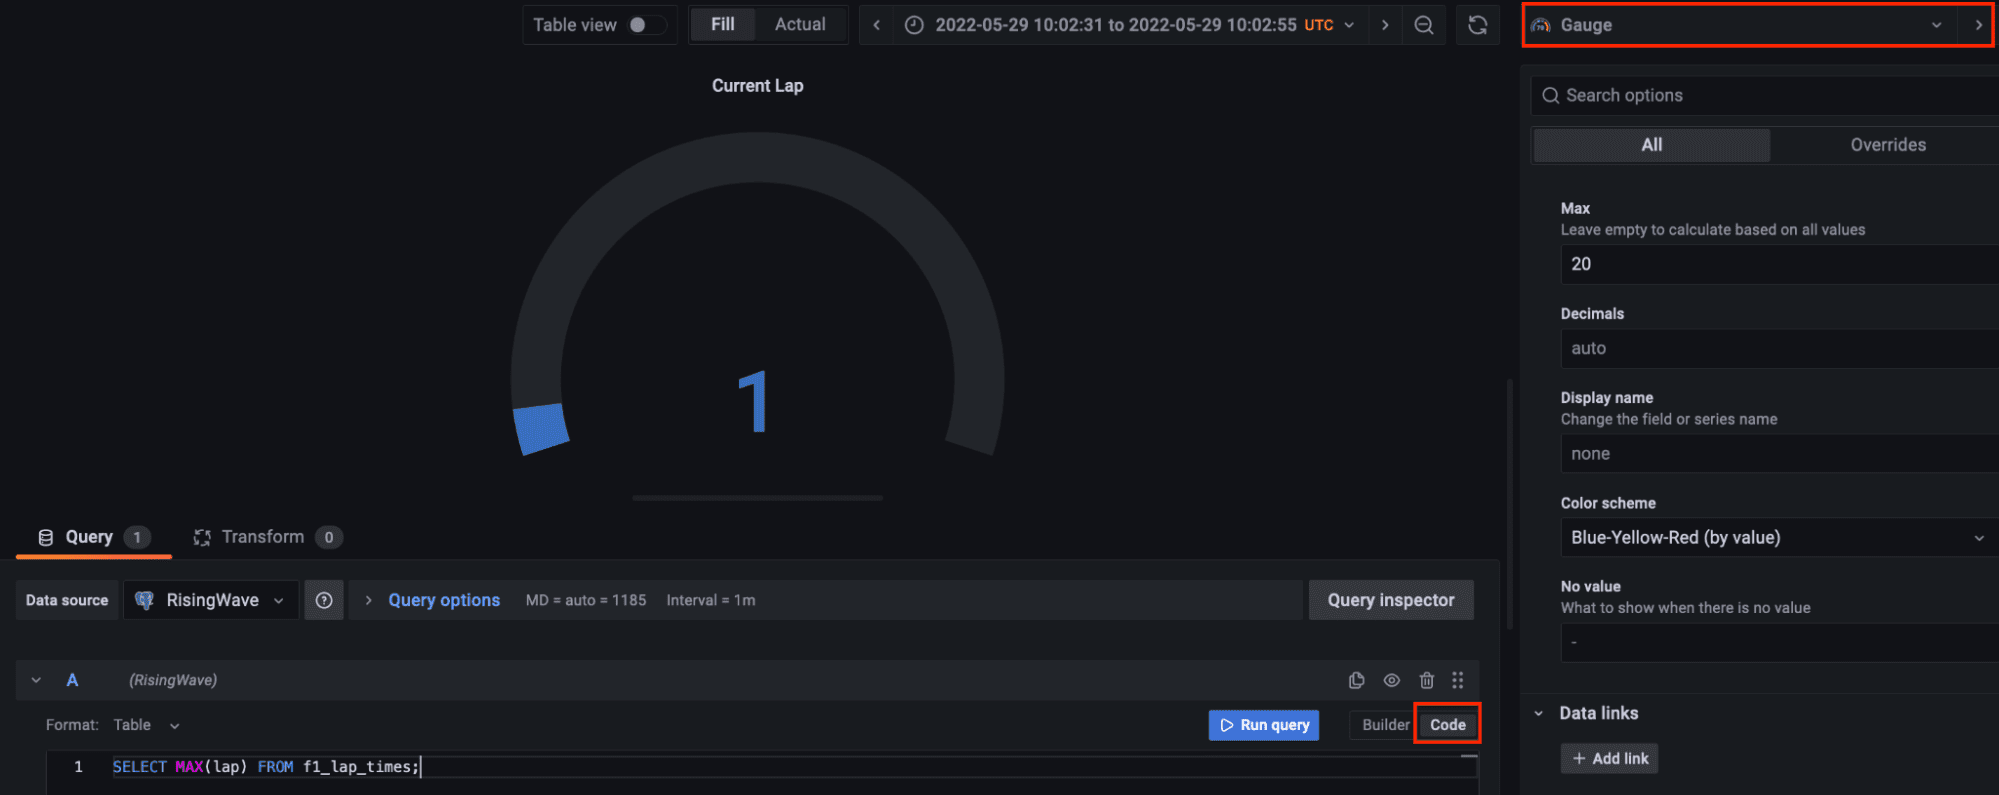
Let’s add another panel to visualize the current lap. Select the gauge visualization and in the code tab query the max lap available in the streaming data. Gauge customization is up to you.
Code by Author
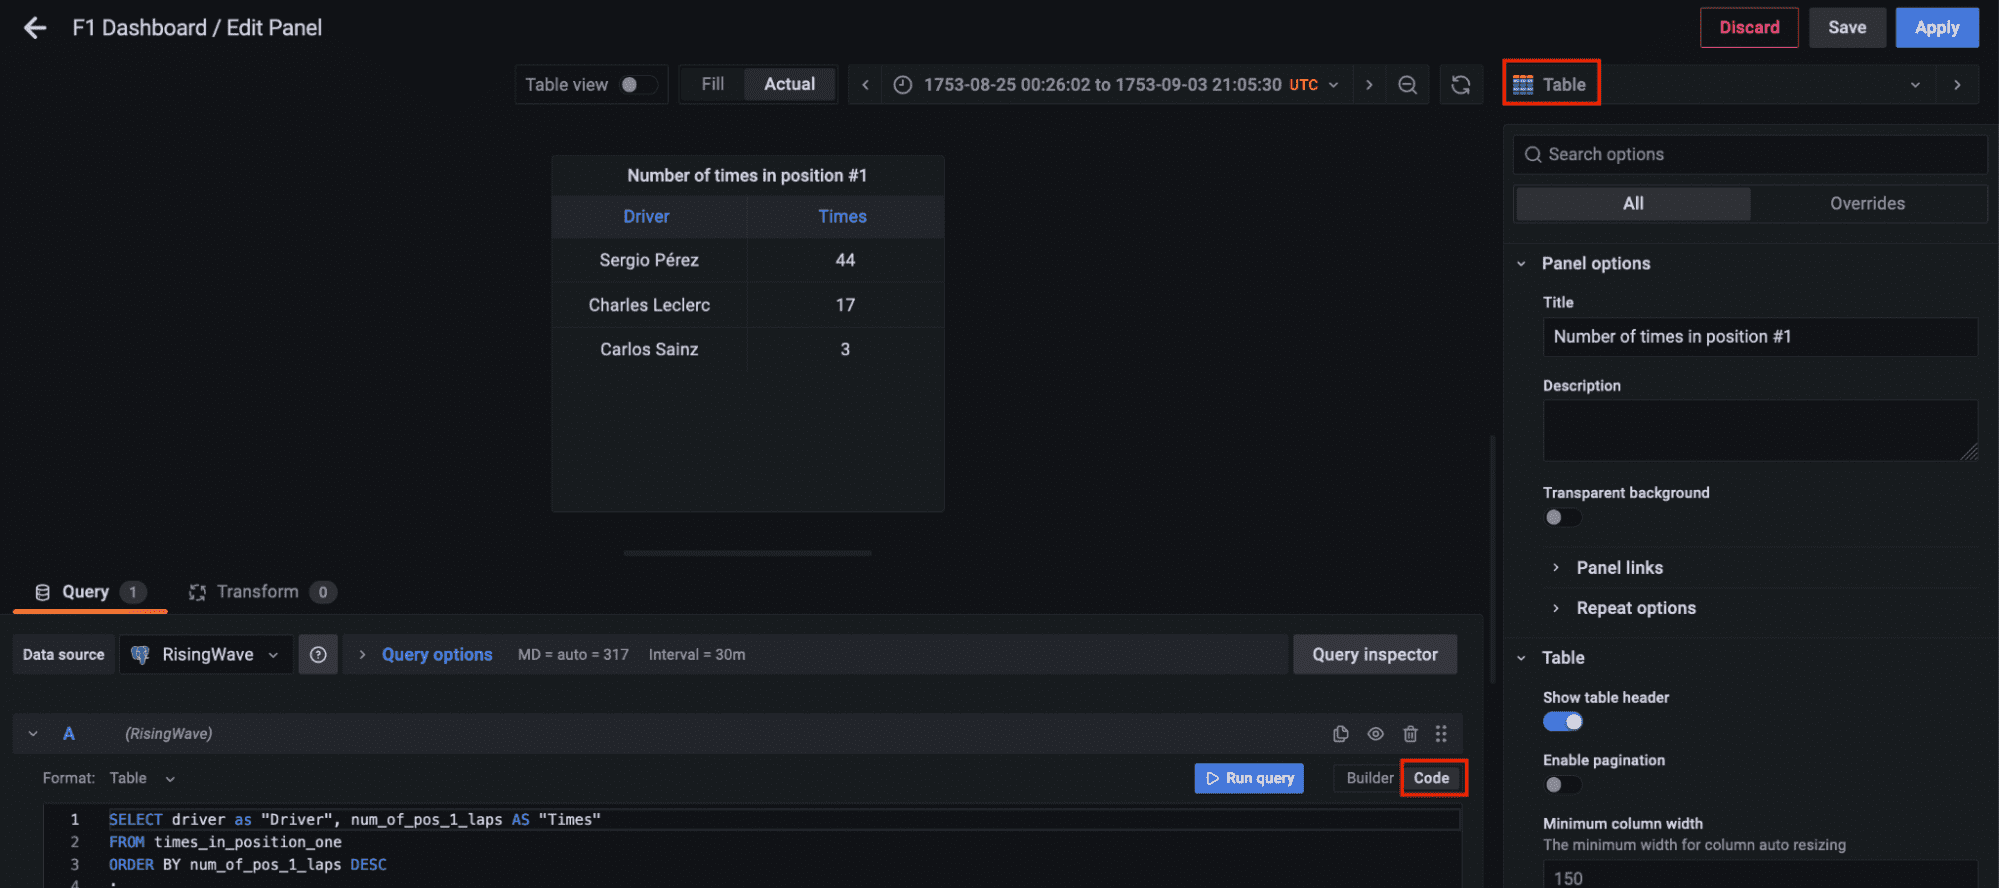
Finally, let’s add another panel to query the materialized view times_in_position_one and see in real-time how many times a driver got the number one position during the whole race.
Code by Author
Visualizing the Results
Finally, all the components for the streaming data pipeline are up and running. The Python script has been executed to start streaming the data through the Kafka topic, the streaming database RisingWave is reading, processing, and joining the data in real-time. The materialized view f1_lap_times reads the data from the Kafka topic and each panel in the Grafana dashboard is a different materialized view joining data in real-time to show detailed data thanks to the joins done by the materialized views to the races and drivers tables. The Grafana dashboard queries the materialized views and all the processing has been simplified thanks to the materialized views processed in the streaming database RisingWave.
Javier Granados is a Senior Data Engineer who likes to read and write about data pipelines. He specialize in cloud pipelines mainly on AWS, but he is always exploring new technologies and new trends. You can find him in Medium at https://medium.com/@JavierGr