


Introduction to Data Science: A Beginner’s Guide
This article is a guide for new data scientists, and it's designed to help you get started quickly. It's meant to be a starting point, but if you're already in the market for a new job, you may want to read this article more.
Image by Author
You haven’t been living under a rock for the last two decades, so you may think you know, more or less, what data science is. You’re probably hoping to get a brief overview of what it entails, to learn what you need to start learning data science and get a job.
Here are the highlights of what this article will give you:
- The main point of data science: data comes in, and insights come out. The job of a data scientist is to manage that data-to-insights pipeline at every stage.
- What tools, technologies, and skills you’ll need to get a job in data science.
- The general landscape of data science as a career.
If that sounds like what you’re looking for, let’s dive in.
What is Data Science?
As I said earlier, data science is best summarized as a data-to-insights pipeline. As a data scientist, no matter what company you’re in, you’ll be doing tasks like:
- Extracting data
- Cleaning or massaging it
- Analyzing the data
- Identifying patterns or trends
- Building prediction and statistical models on top of the data
- Visualizing and communicating the data
In short, you’re solving problems, making predictions, optimizing processes, and guiding strategic decision-making.
Because very few companies have a firm grasp on exactly what a data scientist does, you’ll likely have other responsibilities too. Some employers expect data scientists to add infosec or cybersecurity responsibilities to their role. Others may expect data scientists to have expertise in cloud computing, database management, data engineering, or software development. Be ready to wear many hats.
This job is important not because Harvard Business Review called it the sexiest job of the 21st century, but because data is increasing in volume and very few people know how to turn data into insights. As a data scientist, you see the forest for the trees.
Volume of data/information created, captured, copied, and consumed worldwide from 2010 to 2020, with forecasts from 2021 to 2025
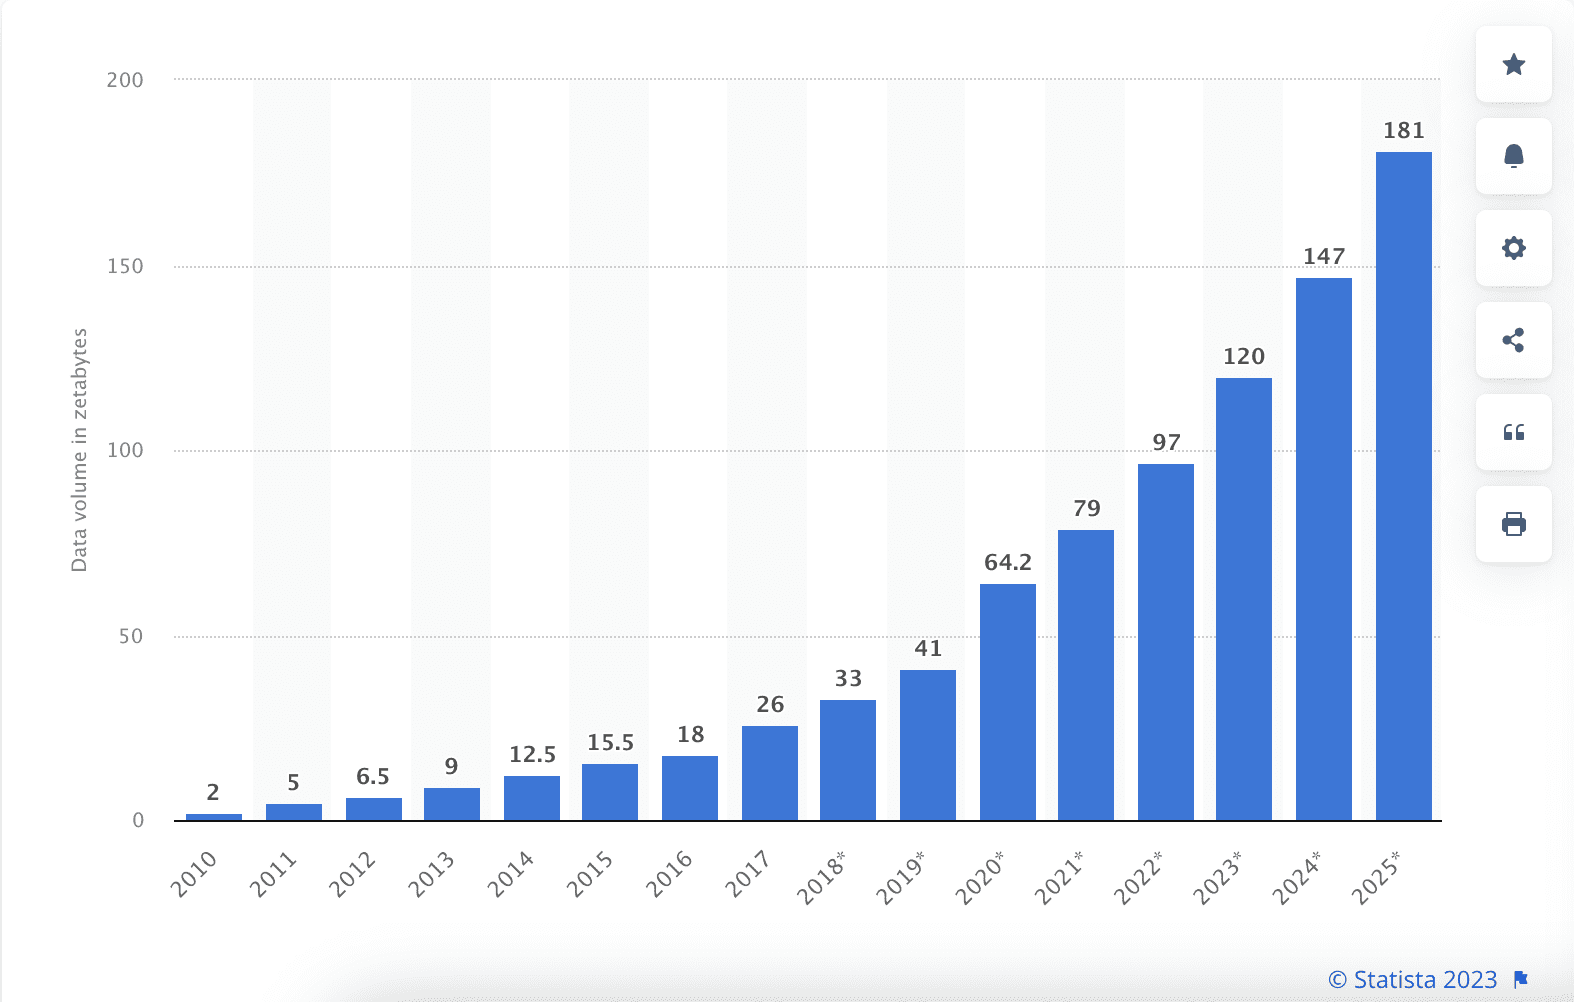
Source: https://www.statista.com/statistics/871513/worldwide-data-created/
Key Concepts in Data Science
Now you’ve got the big picture. Let’s take a look at some of the key concepts in data science. If you can envision that data-to-insights pipeline, I’ll identify where each key concept comes into play.
Data manipulation
At the very start of that pipeline, you’ve got a slurry of data, of mixed quality. There’s a famous (and incorrect) statistic that data scientists spend 80% of their time cleaning data. While it’s probably not as high as that, building funnels and massaging data is a big part of the job.
Imagine you’re a data scientist for an e-commerce company. There, data manipulation might involve cleaning and transforming customer transaction data, merging and reconciling data from different sources such as website analytics and customer relationship management (CRM) systems, and handling missing or inconsistent data.
You might need to standardize formats, remove duplicates or NaNs, and deal with outliers or erroneous entries. This process ensures that the data is accurate, consistent, and ready for analysis.
Data exploration and visualization
Once the data has been wrangled into submission, now you can start looking at it. You might think that data scientists start throwing statistical models at the data immediately, but the truth is there are too many models. First, you need to get to grips with the kind of data you’ve got. Then you can look for significant insights and predictions.
For example, if you’re a data scientist at GitHub, data exploration would involve analyzing user activity and engagement on the platform. You could look at metrics like the number of commits, pull requests, and issues, as well as user interactions and collaborations. By exploring this data, you gain an understanding of how users engage with the platform, identify popular repositories, and uncover trends in software development practices.
And because most humans parse the significance of pictures better than that of tables, data visualization is also included in data exploration. For example, as a GitHub data scientist, you might use line charts to show the number of commits over time. Bar charts could be used to compare the popularity of different programming languages used on the platform. Network graphs could illustrate collaborations between users or repositories.

Source: https://www.reddit.com/r/DataScienceMemes/comments/nzoogr/i_dont_like_gravy/
Statistical analysis
At this point in the data-to-insights pipeline of data science, you’ve got the first two-thirds covered. The data is in, you’re poking and prodding at it. Now it’s time to pull out insights. Finally, you’re reading to apply some statistical analyses to your numbers.
Pretend you’re a data scientist at a company like Hello Fresh. You might run statistical analyses like linear regression to understand the factors that influence customer churn, clustering algorithms to segment customers based on their preferences or behavior, or hypothesis testing to determine the effectiveness of marketing campaigns. These statistical analyses help uncover relationships, patterns, and significant findings within the data.
Machine learning
The cool thing about data scientists is that they predict the future. Visualize the data-to-insights pipeline. You’ve got insights into how things are in the past and now. But your boss might want to ask: well, what happens if we add a new product to our offering? What if we close on Mondays? What if we convert half our fleet to electric vehicles?
As a data scientist, you look into your crystal ball and create intelligent predictions using machine learning. For example, say you’re a data scientist at a logistics company like FedEx. You could use historical shipping data, weather data, and other relevant variables to develop predictive models. These models can forecast shipping volumes, estimate delivery times, optimize route planning, or predict potential delays.
Using machine learning algorithms such as regression, time series analysis, or neural networks, you could predict the impact of adding a new distribution center on delivery times, simulate the effects of different operational changes on shipping costs, or forecast customer demand for specific shipping services.
Communication and business intelligence
The most important concept in data science isn’t machine learning or data cleaning. It’s communication. You present those insights to decision-makers at your company who don’t know a neural network from a gradient-boosting algorithm. That’s communication and business acumen are both key concepts in data science.
Imagine you’re a data scientist at a company like Meta. You’ve just discovered a significant correlation between user engagement metrics and customer retention rates, but you need to share it with a VP of marketing who isn’t familiar with the concept of “statistical significance.” You also need to be familiar with customer lifetime value (CLV) to be able to explain the relevance and importance of your finding.
Essential Skills for Data Scientists
We’ve covered the key concepts in data science. Now let’s take a look at the essential skills you’ll be expected to have as a data scientist. I’ve covered some more granular skills to be a data scientist here if you’re interested in learning more.
Programming languages, data querying, and data viz
It’s hard to rank skills on their importance – data scientists need a mix of skills, all as important as each other. That being said, if there’s one skill you absolutely cannot do without, it’s gotta be coding.
Coding breaks down into a few facets – you need programming languages, typically R or Python (or both). You also need query languages for data retrieval and manipulation, such as SQL (Structured Query Language) for relational databases. Finally, you will probably need to know other languages or programs like Tableau for data visualization, though it’s worth mentioning that a lot of data viz is done with Python or R nowadays.
Math
Remember the statistics I mentioned earlier? As a data scientist, you need to know how to do math. Data viz only goes so far before you need some actual statistical significance. Critical math skills include:
- Probability and Statistics: Probability distributions, hypothesis testing, statistical inference, regression analysis, and analysis of variance (ANOVA). These skills let you make sound statistical judgments and draw meaningful conclusions from data.
- Linear Algebra: Operations on vectors and matrices, solving systems of linear equations, matrix factorization, eigenvalues and eigenvectors, and matrix transformations.
- Calculus: You’ll need to be familiar with concepts like derivatives, gradients, and optimization to train models, optimize, and fine-tune models.
- Discrete Mathematics: Topics like combinatorics, graph theory, and algorithms. You’ll use these to do network analysis, recommendation systems, and algorithm design. It’s most important for developing algorithms that handle large-scale data.
Model management
Let’s talk about models. As a data scientist, you need to know how to build, deploy, and maintain models. This includes ensuring the models integrate seamlessly with the existing infrastructure, addressing scalability and efficiency concerns, and continuously evaluating their performance in real-world scenarios.
In terms of technology, that means you’ll need to be familiar with:
- Machine Learning Libraries: These include scikit-learn in Python, TensorFlow, PyTorch, or Keras for deep learning, and XGBoost or LightGBM for gradient boosting.
- Model Development Frameworks: Frameworks like Jupyter Notebook or JupyterLab for interactive and collaborative model development.
- Cloud Platforms: Think Amazon Web Services (AWS), Microsoft Azure, or Google Cloud Platform (GCP) to deploy and scale machine learning models.
- Automated Machine Learning (AutoML): Google AutoML, H2O.ai, or DataRobot automate the process of building machine learning models without extensive manual coding.
- Model Deployment and Serving: Docker and Kubernetes are commonly used for packaging and deploying models as containers. These let models be deployed and scaled across different environments. Additionally, tools like Flask or Django in Python let you create web APIs to serve models and integrate them into production systems.
- Model Monitoring and Evaluation: Prometheus, Grafana, or ELK (Elasticsearch, Logstash, Kibana) stack for log aggregation and analysis. These tools help track model metrics, detect anomalies, and ensure that models continue to perform well over time.
Communication
So far we’ve covered the “hard” skills. Now let’s think about what soft skills you’ll need. As I mentioned in the “concepts” portion, a big skill you need is communication. Here are a few examples of the kind of communication you’ll need to do as a data scientist:
- Data Storytelling: You need to turn complex technical concepts into clear, concise, and compelling narratives that resonate with your audience, including the significance of your analysis and its implications for decision-making.
- Visualization: Yes, data viz gets its subsection in the communication skill. Alongside the technical chops to create a chart, you should also know when, what kind, and how to talk about your data visualizations.
- Collaboration and Teamwork: No data scientist works in a vacuum. You’ll collaborate with data engineers, business analysts, and domain experts. Practice your active listening and constructive feedback skills.
- Client Management: This isn’t true for all data scientists, but sometimes you’ll work directly with clients or external stakeholders. You need to develop strong client management skills, including understanding their requirements, managing expectations, and providing regular updates on project progress.
- Continuous Learning and Adaptability: Last but not least, you need to be ready to learn new things on the reg. Stay up to date with the latest advancements in the field and be open to acquiring new skills and knowledge as needed.
Business acumen
This boils down to knowing why a number matters in the context of your business. For example, you might find that there’s a highly significant relationship between people buying eggs on Sundays and the weather. But why does it matter to your business?
In this case, you might analyze further and discover that the increased egg purchases on Sundays are correlated with sunny weather, indicating that customers are more likely to engage in outdoor activities or host brunches during favorable weather conditions. This insight could be utilized by a grocery store or a restaurant to plan their inventory and promotional activities accordingly.
By connecting the dots between data patterns and business outcomes, you can provide strategic guidance and actionable recommendations. In the example, this could involve optimizing marketing campaigns for egg-related products during sunny weekends or exploring partnerships with local brunch spots.
Data Science Workflow
What does a data scientist do? To get an idea, let’s take a look at the typical steps involved in a data science project: problem formulation, data collection, data cleaning, exploratory data analysis, model building, evaluation, and communication.
I’ll illustrate each step with an example: for the rest of this section, pretend you work as a data scientist for an e-commerce company, and the company's marketing team wants to improve customer retention.
1. Problem Formulation:
This means you get to grips with the business objective, clarify the problem statement, and define the key metrics for measuring customer retention.
You’ll aim to identify factors that contribute to customer churn and develop strategies to reduce churn rates.
To measure customer retention, you define key metrics including customer churn rate, customer lifetime value (CLV), repeat purchase rate, or customer satisfaction scores. By defining these metrics, you establish a quantifiable way to track and evaluate the effectiveness of your strategies in improving customer retention.
2. Data Collection
Gather relevant data sources, such as customer purchase history, demographic information, website interactions, and customer feedback. This data could be obtained from databases, APIs, or third-party sources.
3. Data Cleaning
The collected data will almost certainly contain missing values, outliers, or inconsistencies. In the data cleaning stage, you preprocess and clean the data by handling missing values, removing duplicates, addressing outliers, and ensuring data integrity.
4. Exploratory Data Analysis (EDA)
Next, gain insights into the data and understand its characteristics by visualizing the data, examining statistical summaries, identifying correlations, and uncovering patterns or anomalies. For example, you may discover that customers who make frequent purchases tend to have higher retention rates.
5. Model Building
Develop predictive models to analyze the relationship between different variables and customer retention. For instance, you might build a machine learning model like logistic regression or random forest, to predict the likelihood of customer churn based on various factors like purchase frequency, customer demographics, or website engagement metrics.
6. Evaluation
Evaluate your model’s performance using metrics like accuracy, precision, recall, or area under the ROC curve. You validate the models using techniques like cross-validation or train-test splits to ensure their reliability.
7. Communication
You’ve got some findings – now share them with the class. In keeping with our example, you’ll need to be able to intelligently talk about your customer churn results in the context of both the business you work for and the wider business landscape. Make people care, and explain why this particular finding matters, and what they should do about it.
For example, after analyzing customer churn, you might find a significant correlation between customer satisfaction scores and churn rates.
When you share this with the marketing team or senior executives, you’ll need to effectively communicate the implications and actionable insights. You would explain that by focusing on enhancing customer satisfaction through improved customer support, personalized experiences, or targeted promotions, the company can mitigate churn, retain more customers, and ultimately drive higher revenue.
Moreover, you would contextualize this finding within the wider business landscape. Compare the churn rates of your company with competitors.
So that’s how you go from data lakes to real business input. Ultimately, remember that data science is iterative and cyclical. You’ll repeat individual steps of this process as well as the entire process as you strive to find interesting insights, answer business questions, and solve problems for your employer.
Data Science Applications
Data science is a vast field. You can find data scientists working in almost every vertical, at any size company. It’s a critical role.
Here are a few real-world examples to showcase the impact of data science in solving complex problems:
- Healthcare: Data scientists analyze large volumes of medical data to improve patient outcomes and healthcare delivery. They develop predictive models to identify high-risk patients, optimize treatment plans, and detect patterns in disease outbreaks.
- Finance: Think risk assessment, fraud detection, algorithmic trading, and portfolio management. Data scientists develop models that help make informed investment decisions and manage financial risks.
- Transportation and Logistics: Data scientists optimize route planning, reduce fuel consumption, improve supply chain efficiency, and predict maintenance needs.
- Retail and E-commerce: Data scientists analyze customer data, purchase history, browsing patterns, and demographic information to develop models that drive customer engagement, increase sales, and improve customer satisfaction.
Getting Started in Data Science
Ok, that’s a lot of information. By now you should have a clear grasp of what data science is, how it all works, what tools and technologies you should be familiar with, and what a data scientist does.
Let’s now look at where to study and practice data science. This could be a separate article, so I’ll link to lists of resources where you can get started.
- The best free data science courses
- The best learning resources for data science (books, courses, and tutorials)
- The best Python data science projects for beginners
- The best computer science books
- Data science visualization best practices
- Where to get data to do your data science projects
- Best platforms to practice key data science skills
- Best data science communities to join
Overall, I recommend you do this:
- Make a checklist of skills you need, using this blog post and data scientist job descriptions.
- Start free to get the basics, then look for good, paid platforms to learn more.
- Build a portfolio of projects and libraries.
- Practice on platforms like Kaggle and StrataScratch.
- Get certified – some platforms like LinkedIn offer certifications to prove you’ve got the skills.
- Start applying.
- Network – join communities, Slack groups, and LinkedIn groups, and attend events.
Ultimately, you can expect the process to take some time. But it will be worth it in the end.
Job Opportunities and Career Path
Despite the FAANG layoffs, according to US News and World Report in 2022, information security analysts, software developers, data scientists, and statisticians ranked among the top 10 jobs.
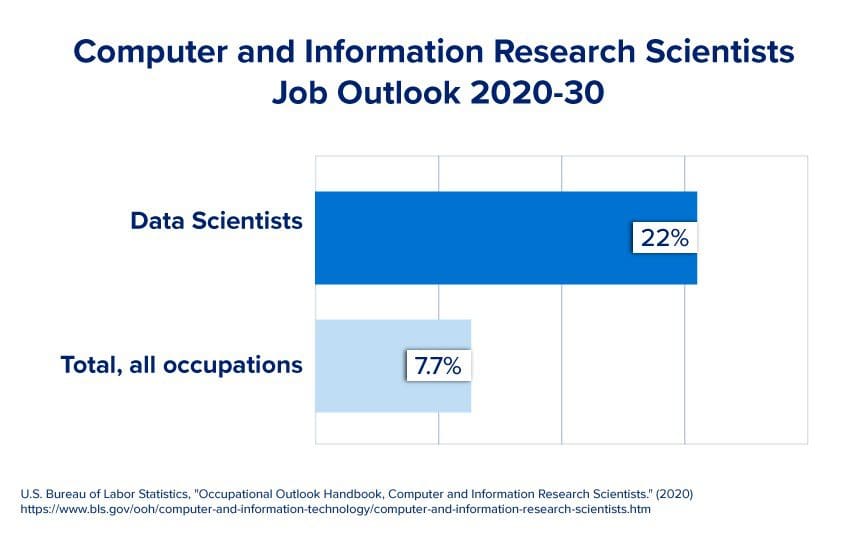
Source: https://bootcamp.cvn.columbia.edu/blog/data-scientist-career-path/
The job market is still hot. Companies still want and need data scientists. Now, if you’re having a hard time getting a job as a data scientist, remember you don’t have to start from scratch. I recommend you start more junior and angle into the role over time. You could always start as a data analyst, data engineer, or machine learning engineer.
Conclusion
It’s hard to write an intro to data science for the simple fact that it’s a huge field, it’s growing, and more technologies and tools get added every day. If you take away just a few things from this post, it’s this:
- Data science takes a multidisciplinary approach. You’ll need skills from across multiple fields of knowledge including statistics, machine learning, programming, and domain expertise. And the learning never stops.
- Data science is iterative. It’s very process based, but you can expect to repeat, optimize, and update your processes as you continue. The successful and happy data scientist embraces experimentation.
- Soft skills are where it’s at. You can’t just be a Python whiz; you need to convey findings and insights to non-technical stakeholders with stories, numbers, and pictures.
Hopefully, this has given you a place to start. Data science is a rewarding and challenging career path. If you learn the skills and apply yourself, you’ll be able to join this field in no time.
Nate Rosidi is a data scientist and in product strategy. He's also an adjunct professor teaching analytics, and is the founder of StrataScratch, a platform helping data scientists prepare for their interviews with real interview questions from top companies. Connect with him on Twitter: StrataScratch or LinkedIn.